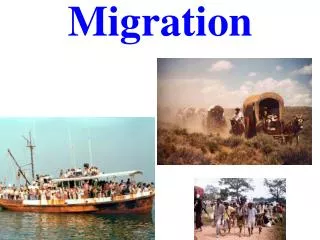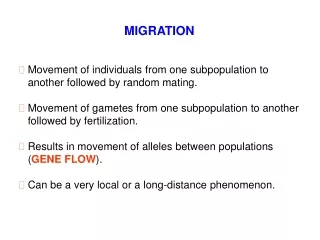
Migration
Migration. AP Human Geography Unit 2. Migration Terms. Mobility Circulation—“ short term” Migration (vs. Circulation) Emigration Immigration Net Migration Net in-migration: Immigrants > Emigrants: Net out-migration: Immigrants < Emigrants. CIA Worldfactbook , April 2006.

Migration
E N D
Presentation Transcript
Migration AP Human Geography Unit 2
Migration Terms • Mobility • Circulation—“short term” • Migration(vs. Circulation) • Emigration • Immigration • Net Migration • Net in-migration: Immigrants > Emigrants: • Net out-migration: Immigrants < Emigrants CIA Worldfactbook, April 2006
Causes of Migration • Push vs. Pull Factors • ECONOMIC • North Dakota Oil Boom • CULTURAL • Iraq War (2003-present) • ENVIRONMENTAL • Hurricane Katrina (2005)
Why did people migrate to the USA? Pull Push Overcrowding in Europe Overcrowding in Europe Overcrowding in Europe Plenty of food in USA Plenty of food in USA Plenty of food in USA Persecution of Russian Jews Persecution of Russian Jews Persecution of Russian Jews Poverty in Europe Poverty in Europe Poverty in Europe The US Bill of Rights The US Bill of Rights The US Bill of Rights Higher pay for US workers Higher pay for US worker Check Answers Higher pay for US workers European class system European class system European class system Religious freedom in US Religious freedom in US Religious freedom in US
Net-migration Using the Population Data Sheet… • Identify the three countries with the highest “net in-migration” rate. • What would be likely pull factors? • Identify the three countries with the highest “net out-migration” rate. • What would be likely push factors? • What problems does using the rate versus the raw number present?
Refugee Global Refugees—There are about 20,000,000 refugees or internally displaced personsworldwide, (estimates vary a lot).The top 10 sources of refugees, asylum seekers and internally displaced persons in 2005 were: • Afghanistan: 1,908,100 • Sudan: 693,300 • Burundi: 438,700 • DR Congo: 4,430,600 • Somalia: 394,800 • Vietnam: 358,200 • Palestinians: 349,700 [or more than 4,300,000, depending on definitions] • Iraq: 262,100 • Azerbaijan: 233,700 • Liberia: 231,100
US Refugee Policy Who is a refugee? In the US [under the Immigration and Nationality Act, Section 101(a)(42)]: • The term 'refugee' means: (A) any person who is outside any country of such person's nationality … who is unable or unwilling to return to, and is unable or unwilling to avail himself or herself of the protection of, that country because of persecution or a well-founded fear of persecution on account of race, religion, nationality, membership in a particular social group, or political opinion, or (B) in such circumstances as the President … may specify, any person … who is persecuted or who has a well-founded fear of persecution on account of race, religion, nationality, membership in a particular social group, or political opinion.
US Refugee Policy • “Wet-foot vs. Dry-foot policy” (1995) • Cuban migrant apprehended in the water is sent back home vs. Cuban who makes it to the U.S. shore, and can qualify for legal permanent resident status and US citizenship • Awkward Arrangement— • Coast Guard frequently use water cannons to steer boats away from the US coast • Cuban migrant running through the surf trying to escape an immigration officer to make it to “dry land” • 2006—15 Cubans were found clinging to a piling off of the coast and sent back to Cuba • “Shout Rule”—have to specifically state your fear of return • Cuba vs. Haiti
US Refugee Policy US Refugees: 2003-2006—The ceiling on US refugee admissions is 70,000 per year. 2003 2004 2005 2006 Africa 20,000 25,000 20,000 20,000 East Asia 4,000 6,500 13,000 15,000 Eastern Europe 2,500 nanana The Former Soviet Union 14,000 nanana Europe &Central Asia na 13,500 9,50015,000 Latin America & Caribbean 2,500 3,500 5,000 5,000 Near East & South Asia 7,000 2,0002,500 5,000 Unallocated Reserve 20,000 20,000 20,000 10,000
US Refugee Policy 2011 2012 Africa 12,000 12,000 East Asia 18,000 17,000 Europe and Central Asia 2,0002,000 Latin America & Caribbean 5,500 5,000 Near East & South Asia 35,500 31,000 Unallocated Reserve 3,000 3,000 Ceiling 76,000 70,000
E.G. Ravenstein’s “Laws of Migration” • Most people migrate for economic reasons. • Cultural & environmental factors may also be important, but not as important as economics • Most migrants move a short distance, and stay within a country. • Long-distance migrants go to major centers of economic activity. • Most long-distance migrants are males. • Most long-distance migrants are adults, not families with their children. **Theory of Human Migration:1885**
Migration Answer the following questions with a partner: • According to Ravenstein, describe the typical migrant? (ie. gender, cause, location, etc.) • Is this still accurate? • Describe who you believe to be the typical migrant today. • What are the time periods in which the US has experienced the greatest in-migration? What were the push/pull factors?
Migrant Characteristics Is Ravenstein still correct? • Today, in the US, most international immigrants are women, not men. • Although most immigrants to the US are still single adults, increasing numbers of immigrants are children (17 years of age or less). • Mexican migrants to the US come from the interior. Why the change?
Migration Patterns • Wilbur Zelinsky… Demographic Transition • Migration patterns change depending on demographic stage • Stage 2—international migration, also rural to urban migration • Examples? • Stage 3 & 4—internal migration, also urban to suburban , the destination of those in stage 2 • Examples?
Migration Patterns • Gravity Model • Migration=Population/Distance (M=P/D) • Also relates to trade, services, etc. • Step Migration • Chain migration • Brain Drain
Migration Terms Intervening Obstacle— • Environmental (ie. oceans) • Cultural (ie. laws) International Migration • Voluntary vs. Forced Migration Internal Migration • Interregional Migration • Intraregional Migration (ie. rural to urban, Counterurbanization) • Most typical U.S. side of the border is uninhabited and separated from Mexico by a fence
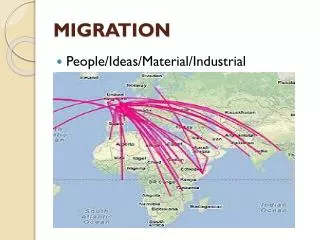
Global Migration Patterns • Only 5% of the world’s population are international migrants (still more than 300 million people) • Net out-migration areas: Asia, Latin America and Africa • Net in-migration areas: North America, Europe, Oceania
US Immigration Patterns 1st Era: Colonial Period (1607-1840) • 2 million Europeans (90% British), 650,000 Africans • Why/Results California is the destination of about 25% of all US immigrants; another 25% go to New York and New Jersey.
US Immigration Patterns 2nd Era: Later European Migration (1840s-1930s) • 1st Peak (1840s-1850s)—4.3 million (German/Irish) • Stage 2 (Migration transition)—repeatedly… “safety valve” • 2nd Peak (1880s)—German, Irish, Scandinavian • 3rd Peak (1900-1930)—Italy, Russia, Austria-Hungary • 1910—14% of US population was 1st/2nd generation immigrant
US Immigration Patterns 3rd Era: Modern Immigration (1970s to Present) • Asian—1970s-1980s (China, Philippines, India, Vietnam)—7 million • Latin American—1980s-Present (Mexico, Dominican Rep, El Salvador) • Today: Asian migrants outnumber Latin American (as of 2013)
US Immigration Policy Evolution of American immigration policy… • Incentivized immigration—largely up to 1924 • Indentured servitude, slavery • Chinese Exclusion Act (1882) • also introduced the “Head Tax” of 50 cents a person • Quota System and Border Patrol established (1924) • Amnesty (1986)—one time • Applied to those arriving before 1982 “Brain Drain”
US Immigration Policy • Undocumented Immigration • No one knows how many immigrants are in the US illegally • Mexico • Central America, Asia, Europe • Enter illegally; or “overstay” visas • Inconsistencies…Haiti vs. Cuba • Economic vs. Political migrants (political asylum) California, Texas, and Florida are the leading destinations for undocumented immigrants to the U.S.
36% Luxembourg 19% Switzerland 9% Austria 9% Germany 9% Belgium 6% France 6% Sweden 5% Denmark 4% Netherlands 4% Norway 4% UK 3% Ireland 2% Spain 2% Italy Immigration Policies Foreign Born as % of European populations
Immigration Policies • Guest Workers— temporarily for employment, not considered permanent migrants • Middle East—wealthy oil states import workers from the Philippines, Sri Lanka, India, Pakistan, and Bangladesh • Foreign workers represent 60 to 90% of labor force in most oil-exporting countries • Time-contract workers— Chinese migrants in Singapore, Malaysia, and Thailand Spanish youths attacked Moroccan immigrants in El Ejido, Spain after an alleged murder.
Immigration Policies • Canada—shortage of skilled labor led to liberal policy visa policy for visas skilled workers, immigrants make up 21.3% of the population (2013) • Japan—faces population decline and lack of skilled labor, finally embraced a point system (academic, business, research background) to allow visa application , immigrants only make up 1.7% of the population due to a history of distrust for immigrants/minorities • Australia—has drawn criticism for their policies, considers anyone not carrying a valid visa to be an illegal and is sent to an immigrant detention center (also found in Switzerland amongst other countries), this includes children (1,062 as of Feb. 2013) Australian Detention Center or “Immigration Residential Housing”
Immigration Policies • Denmark—like Japan has a largely homogenous population and continues to restrict immigration, offers a cash incentive for immigrants to leave, both the Danish spouse and the foreign spouse must be at least 24 years old (has the unintended effect of separating families) to be granted citizenship • Sweden—largely welcomes refugees and immigrants, opposition has increased with recent riots resulting from high unemployment • United Kingdom—the immigrant population has doubled (7.5 million) between 2001-2011, increasing numbers of overstayed visa applicants has resulted in the government requiring applicants pay a 1,000 pound ($1,500) bond, only to be returned when the applicant leaves How do other countries stack up?
Internal Migration • Interregional Migration • Spreading westward since colonial times. • Southern shift since the 1980s • Intraregional Migration—migration within a single region • Rural to Urban • Cities to suburbs • 1800, 5% of the US population lived in suburbs • 75% of the US population now lives in suburbs • Counterurbanization Average annual migrations between regions
Internal Migration The center of U.S. population has consistently moved westward, with the migration of people to the west. It has also begun to move southward with migration to the southern sunbelt.
Intraregional Migration in the U.S. • Includes: • Central Business District (Central City) • Transition (Inner Suburbs) • Suburbs • Rural Ares Average annual migration (in millions) among urban, suburban, and rural areas in the U.S. During the 1990s. The largest flow was from central cities to suburbs.
Net Migration by County, 2000-04 Rural counties in the southwest and Florida have had net in-migration, while there has been net out-migration from rural counties in the Great Plains
Internal Migration • Brazil – migration from the coast to the interior • Indonesia –migration from Java to less populated islands • Russia (Soviet Union) –forced and voluntary migration to the west • India – limits migration • Europe – migrants moving from South to North Brasilia was created as Brazil’s new capital In 1960 and since then has attracted Thousands of migrants in search of jobs.
FRQ Expectations • Definitions and Explanations—should be a minimum of 2 sentences • Examples/Identification—I expect everyone to provide an additional example regardless of what they require (ie. If I ask for two examples of interregional migration, you must provide a third—and will be graded on all three!!!) • Lead with the your most confident response • Other reminders— • Underline important words or phrases • They are looking for accurate information presented in clear, concise manner. VAGUE is the enemy • Most questions are broken into parts (ie. A and B)—Label each part of your response
Population and Migration Exam Review • What are the two most likely discussion questions? • Identify the three most important models for this unit • These are the five most important vocabulary words.