Download
1 / 52
520 likes | 716 Views
The Identification of Human Quantitative Trait Loci. Dr John Blangero Southwest Foundation for Biomedical Research ChemGenex Pharmaceuticals. The Goals: Genetic Analysis of Complex Phenotypes. QTL Localization Where in the genome is the QTL located? QTL Identification

E N D
The Identification of Human Quantitative Trait Loci Dr John Blangero Southwest Foundation for Biomedical Research ChemGenex Pharmaceuticals
The Goals: Genetic Analysis of Complex Phenotypes QTL Localization Where in the genome is the QTL located? QTL Identification What is (are) the gene(s) involved? QTL Allelic Architecture What are the specific QTNs? How many QTNs? What are their frequencies and effect sizes?
Quantitative Traits • Usually closer to gene action than disease itself. • Have superior statistical power.
Quantitative Endophenotypes • Heritable • Genetically correlated with disease or other focal phenotype • Closer to the action of the genes
Liability: The Threshold Model Normals Affecteds Disease-Related Trait
The process of finding and identifying disease-related genes involvesObjective Prioritization.
Different Diseases Different Designs Different Methods
Major Study Designs in Human Genetics: Possible Inferences Inference: Design Heritability Linkage Association Unrelated individuals No No Yes Triads No YesYes Sibling pairs Yes YesYes Nuclear families Yes YesYes Extended pedigrees Yes YesYes
You can exploit:Linkage and Association Information Jointly in Family Studies
Relative Per-Subject Power to Localize QTLs Population Relative Ped. Pedigree Study Efficiency Size Type Jirel (Nepal) 1.00 2300 Extended (isolate) Vermont 0.91 331 Extended SAFHS 0.59 31 Extended GAIT 0.35 19 Extended Framingham 0.24 5 Extended, nuclear Nuclear (4 sibs) 0.17 6 Nuclear Nuclear (3 sibs) 0.11 5 Nuclear Sib-pair 0.04 2 Relative pair
Why I Prefer to Map QTLs by Linkage Power: Linkage vs Association
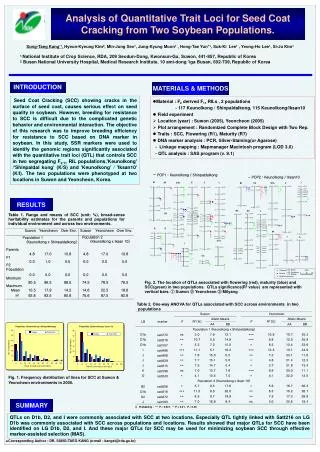
Example 1: Positional Candidate Genes • QTL for serum leptin levels in the San Antonio Family Heart Study • Highly replicated QTL
Bioinformatic Prioritization: GeneSniffer Results 2p22 POMC GCKR UCN
What Do You Do With A Good Positional Candidate Gene? The ALL or NOTHING principle Find all of the variation in the gene. Preference: Resequence everyone (no bias against rare variants) Alternative: Resequence a subset of individuals
How To Find the Most Likely Functional SNPs Bayesian Quantitative Trait Nucleotide Analysis has the potential to aid the discovery of the DNA variants that influence risk of common disease.Objectively prioritizesSNPs for further functional work.
BQTN Analysis: Bayesian Model Selection/Model Averaging Evaluate possible models of gene action. This may be very large, 2n models of additive gene action. Use Bayesian model selection to choose best models and average parameters over models. Eliminates problem of multiple testing. Yields unbiased estimates of effect size. Allows prioritization of polymorphisms for further lab evaluation. Calculation of Posterior Probability of Effect.
The Parallel Ranch 1,500 Processors
Sequential Oligogenic Linkage Analysis Routines All analyses were performed using a parallel version ofSOLARon up to 1,500 processors. For more information on SOLAR, follow the ‘software’ links at: http://www.sfbr.org
BQTN analysis of POMC polymorphisms • Three variants account for 11% of variation in leptin levels. • The frequencies of these variants are: 0.005, 0.004 and 0.06. • LD with any other SNPs is very low: 0.075, 0.248 and 0.189. • It would be VERY HARD to find these by LD.
Linkage Conditional on POMC SNPs Marginal LOD=5.86 Conditional LOD=3.05
What Do You Do With A Good Positional Candidate Region? The ALL or NOTHING principle Find all of the variation in the region, say 5 – 10 Mb. Preference: Resequence everyone (no bias against rare variants). This can be done NOW! It is the wave of the future. Don’t waste time with LD. It is your ENEMY.
Example 2: Identifying Human QTLs Quickly • Expression phenotypes that are cis-regulated should be much easier to quickly identify functional variants and correlate them with disease risk.
Gene Expression Levels as Endophenotypes • Quantitative variation in gene expression levels explains some proportion of the variation in many phenotypes. • The amount of mRNA of a specific transcript in a tissue sample is about as “close to gene action” as possible; hence, such phenotypes ought to be dissectible by statistical genetic approaches. • Array-based technologies make it feasible to quantify the expression levels of many transcripts simultaneously.
Project Description • San Antonio Family Heart Study (SAFHS) designed in 1991 to investigate the genetics of CVD in Mexican Americans • Includes 1,431 individuals from 42 families • 2 recalls since 1991 • Extensive phenotypic data • anthropometry, blood pressure, lipids, obesity, diabetes, inflammation, oxidative stress, hormones, osteoporosis, brain structure/function • Genome scanned
Methodology • Blood samples collected from first SAFHS examination approx 15 years ago • Lymphocytes isolated from blood and stored in RPMI-C media in liquid nitrogen • RNA extracted and expression profiles generated on stored lymphocytes • 47,289 transcripts interrogated using the Illumina platform
Detection Statistics • 1,280 samples analyzed, good data from 1,240 (~97%) • Of the 47,289 transcripts per array, we significantly detected 20,413 transcripts.
Identifying Novel Candidate Genes for Disease Risk • After determining cis-regulated QTLs, look for correlations with phenotypes related to disease risk • Transcriptomic Epidemiology—using high dimensional endophenotypic search • For example, 383 cis-regulated transcripts are significantly correlated with BMI (an index of obesity). • Many of these are novel genes of unknown function.
Expression QTLs: LOD > 3 Approximately, 34% of QTLs are Cis. Effect size (QTL-specific heritability) is 64% larger for Cis QTLs.
Identification of Human QTLs: Example 3 QTL influencing inflammatory response A novel positional candidate gene (SEPS1/SELS) found by expression studies in an animal model
SEPS1 Gene Discovery • SEPS1 (formerly known as Tanis) was first identified by differential gene expression in liver of diabetic P. obesus • Putative functions related to ER stress response through processing and removal of misfolded proteins (Ye et al (2004). Nature 429, 841-847)
SEPS1 Gene Discovery • Human SEPS1 gene is located on 15q26.3 • Mammalian plasma membrane selenoprotein & also a member of the GRP family • Consists of 6 exons, encodes a 204aa protein • 15q26 region shown to contain QTLs influencing inflammatory disorders: • Zamani et al (1996). Hum Genet 98, 491-6. • Field et al (1994). Nat Genet 8, 189-94. • Blacker et al (2003).Hum Mol Genet 12, 23-32. • Susi et al (2001). Scand J Gastroenterol 36, 372-4. • Mahaney et al (2005) Unpublished.
SEPS1 Variant Identification • Sequenced 9.3kb including putative promoter, exons, introns and conserved regions in 50 individuals from three different ethnic populations • 16 variants genotyped in cohort of 522 Caucasian individuals from 92 families • Plasma levels of IL-1, IL-6 and TNF- measured • Results analyzed for association using SOLAR
Association Analysis IL-1 IL-6 TNF-
BQTN Analysis • BQTN analysis strongly supported a model in which the G-105A SNP was responsible for the observed associations with estimated posterior probabilities of >0.999, 0.95, and 0.79 (for TNF-, IL-1, and IL-6 respectively) • Analysis indicates the G-105A SNP is of direct functional consequence (or is highly correlated with a functional variant) • Analysis performed to test the functionality of this G-105A variant
Basal Tunicamycin Effect of A or G variant on SEPS1 promoter activity under Tunicamycin stress conditions P = 0.00006 2.5 2 1.5 Promoter activity (fold change in luc activity over basal) 1 0.5 0 A variant G variant
Cytokine production, Apoptosis Cytoplasm PM Poly-Ub Misfolded protein ER lumen ER lumen Derlin-1 Activation of JNK, caspase12, NFkB p97 26S proteasome SelS chaperone PM Proteins Folded protein chaperone Secretion Golgi mRNA Nucleus Cell survival Physiological Role of SEPS1
Exploring the Effects of the SEPS1 G-105A QTN Looked at the in vivo effects of SEPS1 G-105A QTN on expression levels of SEPS1 and genes in the following Gene Ontology categories: • Endoplasmic Reticulum • Unfolded Protein Response • Golgi Stack and Protein Transportation • Oxidative Stress
SEPS1 G-105A QTN Influences Expression In Vivo • SEPS1 transcript is cis-regulated (as defined by quantitative trait linkage analysis). • The rare A variant is associated with decreased expression in lymphocytes (p = 0.032).