Download

1 / 24
240 likes | 382 Views
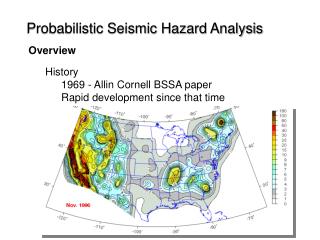
Imaging the Deep Seismic Structure Beneath a Mid-Ocean Ridge: The MELT Experiment. May 1998. Authors. D. W. Forsyth* and D. S. Scheirer, Department of Geological Sciences, Brown University, Providence, RI 02912, USA.

E N D
Imaging the Deep Seismic Structure Beneath a Mid-Ocean Ridge: The MELT Experiment May 1998
Authors D. W. Forsyth* and D. S. Scheirer, Department of Geological Sciences, Brown University, Providence, RI 02912, USA. S. C. Webb, L. M. Dorman, J. A. Orcutt, A. J. Harding, D. K. Blackman, J. Phipps Morgan, Scripps Institution of Oceanography, University of California, San Diego, La Jolla, CA 92093, USA. R. S. Detrick, Y. Shen, C. J. Wolfe, J. P. Canales, Woods Hole Oceanographic Institution, Woods Hole, MA 02543, USA. D. R. Toomey, Department of Geological Sciences, University of Oregon, Eugene, OR 97403, USA. A. F. Sheehan, Department of Geological Sciences and Cooperative Institute for Research in Environmental Sciences (CIRES), University of Colorado, Boulder, CO 80309, USA. S. C. Solomon, Department of Terrestrial Magnetism, Carnegie Institution of Washington, Washington, DC 20015, USA. W. S. D. Wilcock, University of Washington, School of Oceanography, Seattle, WA 98195, USA.
What’s the point? • Crust at spreading centers is observed to form along an axis 1-2 Km wide. • How is melt produced and how is melt transported to this narrow spreading zone?
Two Models for Melt Production and Transport • Dynamic Flow • Passive Flow
Dynamic Flow • Most melt is produced in an area a few km across directly below the axial zone. • Melt transport is primarily vertical. • Several percent melt must be retained in the mantle matrix provide buoyancy and reduce viscosity in the upwelling region.
Passive Flow • Driven by viscous drag from sinking slabs of ocean crust. • Zone of upwelling and melt production may be ~100 km across. Horizontal migration of melt to the observed spreading axis. • Melt concentration can be as low as a few tenths of a percent because experiments indicate porous flow may be very efficient at extracting melt.
Passive vs. Active • Passive Flow - Relatively shallow upwelling from the top of the mantle • Active Flow - Ridges linked to structures in the lower mantle and melt production is part of a whole-mantle convection system. • Active Flow does not imply that rising melt is pushing the plates apart.
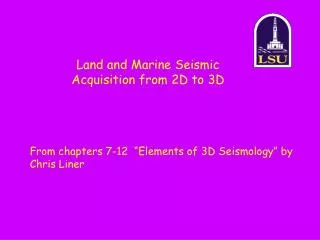
MELT Mantle Electromagnetic and Tomography Experiment Gather data to constrain: • Pattern of upwelling beneath a ridge • Geometry of region of partial melting • Melt concentration in that region • Distribution of melt in matrix • Connectedness of melt pockets Arrays of seismometers, electrometers, and magnetometers deployed on the sea floor across the East Pacific Rise. This paper details the seismological results and is the first in a series of eight papers
East Pacific Rise • The longest, straightest section of the global spreading system. • One of the fastest - 145km/my. • Theory predicts that passive flow is most likely to be dominant at faster spreading rates. The EPR provides a test of that theory. • Likely teleseismic (earthquake) sources are distributed at a wide range of azimuths and the paths are relatively simple.
Asymmetry in the East Pacific Rise • Sea floor is subsiding more slowly on Pacific Plate to the west than on Nazca plate to the east. • Pacific Plate has more volcanic sea mounts than the Nazca plate. • Pacific Plate is moving west almost twice as fast to the west as the Nazca plate is moving east, yet the spreading ridge is jumping to the west so fast that the Nazca plate is actually gaining more material. • Surface asymmetries may reflect sub-surface asymmetries
And what did they find? (drum roll)
Pattern of Upwelling and Geometry of Region of Melt • Velocities are low to the west of the axis and increase rapidly east of the axis. • Velocities in the 15-70 km depth range are so low that they must indicate presence of melt. • The region of low velocities is several hundred km across, clearly not the narrow upwelling predicted by dynamic flow models. • High melt concentrations extend to a depth of nearly 100km. • No structure is visible in the 300 – 410km range, so it is unlikely that upwelling is part of whole mantle convection
Pattern of Upwelling and Geometry of Region of Melt • There must be more melt present west of the ridge • That might explain the observed slow subsidence of the Pacific Plate and the increased volcanism associated with sea mounts.
Melt Concentration • Maximum degree of melting is expected to be about 20%, so melt must be efficiently extracted from the mantle.
Distribution of Melt in Matrix • The ratio of S to P anomalies indicate that melt is distributed in pockets with a shape somewhere between a thin film and a spheroid.
Connectedness of Pockets of Melt • Seismic Anisotropy does not appear to be caused by fluid filled cracks. • The observed fast direction for S-waves is perpendicular to the ridge, the expected slow direction if cracks were the cause. • The cause is probably mineral grain alignment caused by the shear stress of the Pacific plate. • The data do not give good information on connectedness of melt pockets.
Summary • The data support the passive flow hypothesis • Melt is produced in a broad region several hundred km across and at least one hundred km deep.
Why is there an asymmetry? • Return mantle flow from the Pacific Superswell to the west may carry hotter material to the region • The westward motion of the Pacific Plate drags this material back west, creating more off axis melting than east of the ridge.
Methodology • 51 Seismometers deployed on the ocean bottom across the EPR in two linear arrays ~800km long. • 6 month recording period. • good distribution of large seismic events • Data acquisition completed in 1996
Results • Pattern of upwelling beneath a ridge • Geometry of region of partial melting • Melt concentration in that region • Distribution of melt in matrix • Connectedness of melt pockets
Surprise • Slowest velocities (higher melt concentrations) are not directly below the ridge. The center of upwelling may be off axis and carried to the ridge diagonally. Or maybe not.