Download
1 / 1
10 likes | 115 Views
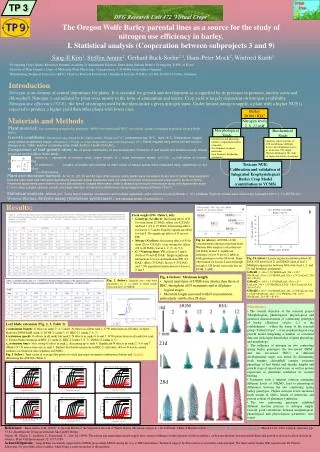
TP 3. a. 21d. 28d. The Oregon Wolfe Barley parental lines as a source for the study of nitrogen use efficiency in barley. I. Statistical analysis (Cooperation between subprojects 3 and 9). Sang-Il Kim 1 , Steffen Amme 2 , Gerhard Buck-Sorlin 2,3 , Hans-Peter Mock 2 , Winfried Kurth 3.

E N D
TP 3 a 21d 28d The Oregon Wolfe Barley parental lines as a source for the study of nitrogen use efficiency in barley. I. Statistical analysis(Cooperation between subprojects 3 and 9) Sang-Il Kim1, Steffen Amme2, Gerhard Buck-Sorlin2,3, Hans-Peter Mock2, Winfried Kurth3 1Pyongyang Crop Genetic Resources Institute, Academy of Agricultural Sciences, Duru-dong, Sadong District, Pyongyang, D.P.R. of Korea. 2Institute of Plant Genetics, Dept. of Molecular Plant Physiology, Corrensstrasse 3, D-06466 Gatersleben, Germany 3Brandenburg Technical University (BTU), Chair for Practical Informatics / Graphical Systems, P.O.Box 101344, D-03013 Cottbus, Germany Introduction Nitrogen is an element of central importance for plants. It is essential for growth and development as is signified by its presence in proteins, nucleic acids and chlorophyll. Nitrogen is assimilated by plant roots mostly in the form of ammonium and nitrate. Crop yield is largely dependent on nitrogen availability. Nitrogen use efficiency (NUE): the level of nitrogen used by the plant under a given nitrogen input. Under limited nitrogen supply, a plant with a higher NUE is expected to produce a higher yield than other plants with lower ones. Barley DOM / REC Materials and Methods Plant material:Two contrasting spring barley genotypes: ‘DOM’ (two-rowed) and ‘REC’ (six-rowed): parents of mapping population 'Oregon Wolfe Barley'. Growth conditions:Greenhouse (day-length 16 hrs, light intensity 300µmol m-2 s-1, temperature day 18°C, night 16°C.Temperature logged using mobile temperature logger at frequency 1/30 min, to obtain temperature sum (base temperature 1°C). Plants irrigated daily with a nutrient solution (Geiger et al., 1999): solution containing either 2mM, 8mM or 12mM of NH4NO3. Comparison of leaf growth rates:No. of plants restricted to 12 plants/treatment. Extension of leaf blades and sheaths usually follows a sigmoid function (Buck-Sorlin 2002): where a = asymptote of function (max. organ length), b = slope (extension speed: cm/°Cd), x0=half-value of function (characterizes timing of extension). Lengths of blades and sheaths of main culms of twelve plants were measured daily, repetitively on the same organs and thus non-destructively. Nitrogen levels 2, 8, 12 mM Morphological Study Biochemical Study • Growth rate and phenology • of leaves (reparameterisation • of model) • Development of apical • meristems • Leaf biometry (herbarium • specimens) • Analysis of key enzymes of • C/N-metabolism (different • tissues, developmental stages) • as a function of N-supply • Western blotting for the study • of expression levels of enzymes. Testcase NUE: Calibration and validation of Integrated Ecophysiological Barley Crop Model (contribution to VCMS) Plant and meristem harvest: At 14, 21, 28, 35 and 42 days after sowing, entire plants were harvested. Every leaf of a plant was separated from the main stem and herbarium specimens prepared. Apical meristems were cut under binocular microscope and preserved in alcohol (100%). Preserved specimems were stained in astra blue/safranin. Images were taken under a dissecting binocular microscope along with appropriate scale (1 mm) using a digital camera. Length and basal diameter of meristems determined using image analysis software ("Korn"). Statistical analysis: ANOVA (incl. Tukey test of pairwise comparison) and multiple regression, were carried out using Minitab v. 12.1 software. Sigmoid models were fitted using Sigmaplot 2001, v. 7.0 (SPSS Inc.) Western Blotting, Enzyme assay (Glutamine synthetase) : see separate poster of subproject 3 Results: b • Fresh weight (FW) (Table 1, left): • Genotype (G) effects: Increasing effect of G for stem (from 28 DAS), tillers (on 42 DAS) and leaf 1 (21 to 35 DAS). Decreasing effect for leaves 2, 5 and 6. Equally significant effect for leaf 4. No significant effect of G on root FW. • Nitrate (N) effects: Increasing effect of N for stem (28 to 35 DAS), (very strong for) tillers (28 to 42 DAS), leaves 1, 2, (3, 4), 5, 6. • G * N interactions: FW of leaves 3 and 6 (both at 35 and 42 DAS). Single significant interactions for root and main stem FW (14 DAS), tillers (35 DAS), leaves 4 (35 DAS) and 7. No significant interactions for leaves 1, 2 and 5. Fig. 1a (above): ANOVA of GS concentration (amount of protein from Western Blot analysis) at last harvest (42 DAS) in leaf 1: significant influence of low N level (2 mM) in both genotypes on the GS level. Same observation for leaves 2 and 4 (though in rank 4, GS levels were only low in DOM, 2 mM). Fig. 1b (above): Linear regression between final (42 DAS) GS level (leaf 2) and SPAD value of leaf 1. Multiple regressions between GS levels (leaf 1, 2, and 4) and biometric parameters: GSleaf1 = -146 + 1,58*SPADLeaf4_35d + 1,20 * SPADLeaf5_35d + 1,32*SPADLeaf5_42d + 1,79*LenLeaf2_35d (R2 = 80,0%) GSleaf2 = - 88,4 + 1,33*SPADLeaf5_35d + 1,67 * LenLeaf4_35d + 1,75*SPADLeaf3_35d - 0,826*LenLeaf3_42d (R2 = 62,6%) GSleaf4 = 102 + 1,04*SPADLeaf2_42d - 2,54*LenLeaf1_28d + 0,828*SPADLeaf1_42d + 5,71*FWStem_35d - 2,03 * SPADLeaf1_21d (R2 = 81,4%) • Fig. 4 (below): Meristem length. • Apical meristems of DOM were shorter than those of REC, throughout all N treatments and at all pheno- • logical stages. • Meristem length increased with N concentration, particularly visible after 28 days. Fig. 2 (below):Sigmoid curve with three parameters (a, b, x0) fitted to blade length extension data (see M&M). • Summary • The overall objective of the research project ‘Morphological, phenological, physiological and genetical characterization of contrasting genotypes of barley (Hordeum vulgare L.)’ is the establishment – within the frame of the research group "Virtual Crops" – of an ecophysiological crop growth model integrating a number of correlated data sets with expert knowledge of plant physiology and morphology. • The influence of nitrogen on two contrasting spring barley genotypes, the two-rowed ‘DOM’, and the six-rowed ‘REC’, at different developmental stages was tested, by determining fresh weights, chlorophyll content, extension phenology of leaf blades and sheaths, lengths and growth stage of apical meristems, as well as protein expression of glutamine synthetase by western blotting. • Treatment with a nutrient solution containing different levels of NH4NO3 lead to phenological differences between the two contrasting spring barley genotypes. Higher nitrogen levels increased fresh weight of tillers, length of meristems and protein content of glutamine synthetase. • The two contrasting genotypes exhibited different reaction patterns to nitrogen supply. Overall, good correlations between morphological, phenological and physiological parameters were found. Leaf blade extension (Fig. 2, 3, Table 2): a (maximum length): G effect in ranks 2, 4, 5 and 6, N effects in all but rank 2, G*N interaction in all ranks. Longest blades in DOM-8mM (rank 2), DOM-2 (ranks 3, 4), REC-12 (ranks 5, 6, 7). b (extension speed): G effects in all ranks but rank 2, N effects in ranks 4, 6 and 7, G*N interactions in all ranks but rank 2. Fastest blade extension in REC-12 (rank 2), REC-2 (ranks 3, 6, 7), DOM-12 (ranks 4, 5). x0(extension time): Very strong G effect in rank 2, decreasing up to rank 4. Significant N effects in ranks 2, 4, 6 and 7. (Weak) G * N interaction only in rank 3. Earliest leaf blade extensions in REC-2 (all ranks) low N levels caused earliness of extension (also tendency in DOM). Fig. 3 (below): Time series of average data points for each genotype-treatment combination (blades and sheaths), illustrating the ANOVA (Table 2). References: Buck-Sorlin, G.H. (2002): L-System Model of the Vegetative Growth of Winter Barley (Hordeum vulgare L.). In: D.Polani, J.Kim, T.Martinetz (Eds.): Fifth German Workshop on Artificial Life. March 18-20, 2002, Lübeck, Germany. pp. 53-64. Akademische Verlagsgesellschaft Aka GmbH, Berlin Geiger, M., Haake, V., Ludewig, F., Sonnewald, U., Stitt, M. (1999): The nitrate and ammonium nitrate supply have a major influence on the response of photosynthesis, carbon metabolism, nitrogen metabolism and growth to elevated carbon dioxide in tobacco. Plant Cell Environment 22: 1177-1199. Acknowledgments: Sang-Il Kim was kindly supported by InWent programme AB044 during his stay at IPK Gatersleben. Technical support by Petra Linow is gratefully acknowledged. The third author thanks IPK, in particular Dr. Patrick Schweizer, for providing office facilities while being a guest researcher at the institute.