Download
1 / 25
250 likes | 382 Views
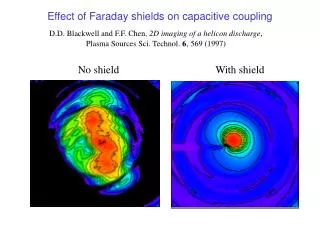
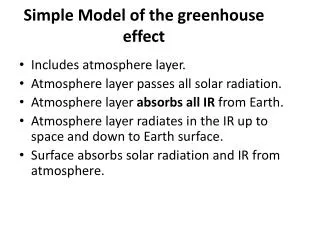
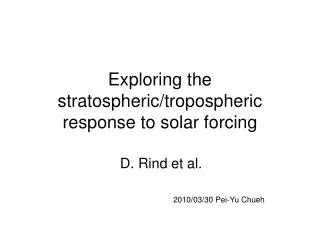
The Effect of Poleward Propagation on the Stratospheric-Tropospheric Coupling in a Simple GCM. Cegeon Chan & Alan Plumb 2007 AGU Chapman Conference 9/24/07. Introduction. Observations have shown that the troposphere and stratosphere can by dynamically linked

E N D
The Effect of Poleward Propagation on the Stratospheric-Tropospheric Coupling in a Simple GCM Cegeon Chan & Alan Plumb 2007 AGU Chapman Conference 9/24/07
Introduction • Observations have shown that the troposphere and stratosphere can by dynamically linked • Annular mode pattern extends from the surface through into the stratosphere Thompson and Wallace (2000)
Introduction, II • Observations have shown that stratospheric signals may propagate downward and project onto the annular mode • Just how strongly can this change the tropospheric circulation? Baldwin and Dunkerton (2001)
Introduction, III • From a modeling study, a stratospheric thermal perturbation can change the tropospheric circulation Kushner and Polvani (2004)
Introduction, IV P = 250 mb • In their “control run,” the decorrelation time scale ~250 days. Not realistic.
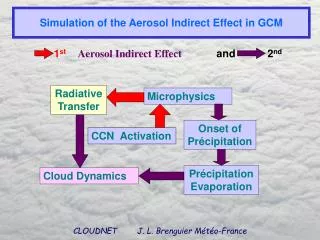
Do their modeling results hold under a different tropospheric regime? i.e. applying the same stratospheric forcing, but now changing the tropospheric setup, will we get the same results? Motivation
More specifically, what happens if we vary ? -10 -20 -30 -10 -20 -30 -10 -20 -30 PK PK PK N N N N N N NV V NV V NV V PK PK PK N N N N N N Motivation
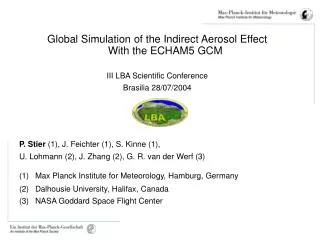
Model Setup • GFDL AGCM dynamical core • T30 Spectral resolution, 3.75ox 3.75o • 40 vertical sigma levels with about 17 in the troposphere • Held and Suarez (1994) setup • Teq troposphere (with a sin() asymmetry) • Newtonian Cooling (40 day)-1 • 6 hyperdiffusion • Everything is virtually the same as Polvani and Kushner (2002) except for the tropospheric equilibrium temperature • Model experiments are integrated for at least 5000 days
PK N N = -30 PK N N -10 -20 -30 NV V Results • Note that the stratospheric Teq is the same as Polvani & Kushner (2002)
Results, II = -30
Questions ( Response • mode ) = decorrelation x ( Forcing • mode ) • Use fluctuation-dissipation theorem • The weak response must be associated with either • a) low decorrelation • b) a weak projection of the forcing onto the mode • Changing the tropospheric setup, do we get the same results as Polvani & Kushner (2002)? • No, results show a significantly weaker tropospheric response • Why is that?
= -10 = -30 Forcing x mode • Maybe the forcing isn’t projecting as strongly onto the mode in our weak response? • We project the thermal forcing with the SVD of the covariance of [u] and [T]
-10 -20 -30 NV 2608 2425 5798 4324 884 760 Forcing x Mode Forc • mode Resp.•mode
EOF1 of [u] PK N N PK N N -10 -20 -30 NV V Uforced – Ucontrol Response x Mode =-10 =-20 =-30
-10 -20 -30 NV 2608 2425 5798 4324 884 760 Forcing x mode & Response x mode • Despite having a stronger projection of the forcing onto the mode, the response is weaker • We cannot say the forcing projecting onto the mode is the reason for the weaker tropospheric response Forc • mode Resp.•mode Maybe due to the low decorrelation?
-10 -20 -30 PK N N NV V PK N N =-10 =-20 Latitude (deg) =-30 Results,III Relative angular momentum anomalies at P = 250 mb from “control run” cases Time (days) Time (days)
Effect of Poleward Propagation • The decorrelation time scale (at least in models) decreases in a jet oscillation to poleward propagation regime. Consistent with Son et. al. (2007). • Results seem consistent with work done Son & Lee (2005). They found that “climate predictability” is low in cases of poleward propagation
225 38 29 Fluctuation-dissipation Theorem Decorrelation time scale (days) • Does the form of the tropospheric variability matter in the stratospheric / tropospheric coupling? • Fluctuation Dissipation Theorem would suggest a significantly weaker response, consistent with our results -10 -20 -30 NV V PK N N
Our results show a significantly weaker tropospheric response Why is that? Forcing not projecting onto the mode is not the reason. A lower (more realistic) decorrelation time scale can help explain the weaker tropospheric response Take home message: Results from idealized simple GCM models with unrealistically long decorrelation time scales seem to be overly sensitive to external forcing. Therefore, such models may be over exaggerating responses from forcings Conclusion
=-10 =-30
=-10 =-20 =-30
-10 -20 -30 PK N N NV V PK N N