Download

1 / 19
190 likes | 332 Views
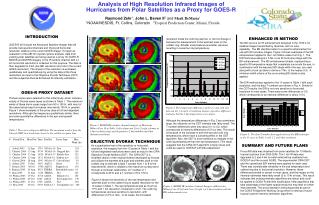
This presentation details the use of Meteosat SEVIRI satellite data for near-real-time, high-resolution analysis of fractional snow cover and snow depth across western and central Europe. The analysis is performed at a 2 km resolution, providing realistic snow depth maps that enhance winter weather forecasting with the COSMO model. We discuss the challenges of cloud obscurance and the method to differentiate between cloud and snow through improved temporal frequency. The results indicate a high correlation with in-situ observations, demonstrating the effectiveness of this snow analysis technique.

E N D
High Resolution Snow Analysis for COSMO jean-marie.bettems@meteoswiss.ch COSMO General Meeting18-21 September 2007
20040310 Satellite data Near real time, high resolution, composite, partial snow cover Based on: Meteosat SEVIRI
20070325 Snow depth analysis Near real time, high resolution, snow depth anaysis Based on: in-situ observations, Meteosat mask, COSMO model
Summary • Fractional snow cover is derived from satellite automatically, in near-real time, at 2 km resolution. • A snow depth map is produced daily over western and central Europe on a 2.2 km grid. • both are unique • snow depth map is more realistic than current products; Meteosat information generates more realistic small scale structures by adding or removing snow patches • improved COSMO near surface weather in winter (e.g. 2m T)
Summary - Deliverables • Snow depth analysis for COSMO-7 in production • Snow depth analysis for COSMO-2 in pre-production • Scientific (EUMETSAT final report) and technical documentation available
Satellite data General problems: • obscurance of the surface by clouds • confusion of ice clouds and snow (similar spectral signatures) Solution: • high temporal frequency MSG SEVIRI EUMETSAT Fellowship: • detect dynamic behaviour of clouds for improving the discrimination between clouds and snow (with respect to spectral classification alone) • detect all cloud-free instances to reduce obscurance of surface by clouds • map snow cover automatically and in near-real time Introduction
clouds snow Satellite data SEVIRI characteristics • Coarse to medium spatial resolution: 5-6 km and 1.5-2 km (HRV) • High temporal resolution: each 15 minutes, only day-time images used • Adequate spectral resolution: 12 spectral channels, 10 used: 1 VIS 0.635 m 2 VIS 0.81 m 3 NIR 1.64 mm 4 IR3.92m 5 IR 6.2 mm 6 IR 7.3mm 7 IR 8.7 mm 8 IR 9.7 mm 9 IR10.8 mm 10 IR12.0 mm 11 IR13.4 mm 12 HRV 0.7 mm
Satellite data Classification scheme: multi-channel colour composite (red: snow or ice clouds) temporal standard deviation, channel 3 (dark: low; bright: high) classification result (white : snow; dark gray : clouds)
Satellite data • Snow cover products: • instantaneous snow map • daily composite snow map: all cloud free instances from 1 day combined • running composite snow map: continuously updated with the latest cloud-free information (each pixel displays the latest instance that the pixel was cloud-free) • quality flag taking into account snow depth at time of occultation • q=f(time,sza,n) • Properties: • fully automatic processing in near-real time (new image processed 2.5 hours after acquisition, each 15 minutes) • fractional snow cover • normal SEVIRI resolution (5-6 km) and high SEVIRI resolution (1.5-2 km)
Satellite data Examples 20040310 13:12 UTC 20040308-20040310, composite snow fraction 20040310 13:12 UTC, snow fraction 20040308-20040310, composite quality
Satellite data Examples high resolution normal resolution
20051204 20061204 Satellite data Results • winter 2005/2006: • normal resolution: 94% correlation with in situ observations • consistent quality over the whole period • March + April 2007: • normal resolution: 95% correlation (only Alps: 83%) • high resolution: 96% correlation (only Alps: 87%)
Snow analysis: method DWD software package for computing snow depth maps, adapted and optimised at MeteoSwiss for use with MSG SEVIRI. • Cressman analysis • Interpolation between observations of snow depth • depending on observation density: • use interpolated snow depth only, • or add interpolated precipitation • or add model snow depth • compare with satellite data • always use latest version of running composite SEVIRI snow map • resample SEVIRI snow map to model space • only use satellite information that has high quality • remove/add snow from Cressman analysis to match SEVIRI information
Case study 24.05.2007: Alps SLF Snow analysis
Current data set • mainly synop • sparse Potential additional data set • considerably more data, but … • … several data providers • … several data formats In-situ observations
observations from aLMo database and additional data set Case study: additional observations 20070325, COSMO-2 observations from aLMo database
Snow analysis: alternative interpolation method Snow depth generally increases with surface altitude use local gradients for interpolation: for each model grid point (x,y,z): • find np observation sites with smallest distance , only use sites within horizontal distance Rmax and within vertical distance Hmax • make linear regression for these sites: snow depth = a + b z (weight the contribution of each site with the inverse of d) • use this regression line to compute the snow depth at (x,y,z) (only when enough of the np sites display snow, e.g. half of them)
Snow analysis: alternative interpolation method Cressman analysis altitudinal interpolation (note: different geographic projection, no influence of satellite data)
Outlook • Merge latest DWD snow analysis modifications with new software • Access to additional in-situ observations • Currently DWD data can not be decoded • Interpolation with altitudinal gradient • more realistic than Cressman interpolation over steep topography, but enough observations with snow must be present • use gradient-interpolation to identify bad observations • merge gradient-interpolation with cressman analysis, e.g. with weighted mean • Use partial snow cover in COSMO/TERRA • Use EUMETSAT SAF snow albedo in COSMO • Introduce a more sophisticated snow model