Download
1 / 37
400 likes | 683 Views
Pin Building Customized Program Analysis Tools with Dynamic Instrumentation. CK Luk, Robert Cohn, Robert Muth, Harish Patil, Artur Klauser, Geoff Lowney, Steven Wallace, Kim Hazelwood Intel. Vijay Janapa Reddi University of Colorado. http://rogue.colorado.edu/Pin. Instrumentation.

E N D
Pin Building Customized Program Analysis Tools with Dynamic Instrumentation CK Luk, Robert Cohn, Robert Muth, Harish Patil, Artur Klauser, Geoff Lowney, Steven Wallace, Kim Hazelwood Intel Vijay Janapa Reddi University of Colorado http://rogue.colorado.edu/Pin
Instrumentation • Insert extra code into programs to collect information about execution • Program analysis: • Code coverage, call-graph generation, memory-leak detection • Architectural study: • Processor simulation, fault injection • Existing binary-level instrumentation systems: • Static: • ATOM, EEL, Etch, Morph • Dynamic: • Dyninst, Vulcan, DTrace, Valgrind, Strata, DynamoRIO CPin is a new dynamic binary instrumentation system
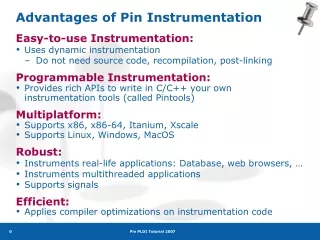
Advantages of Pin Instrumentation • Easy-to-use Instrumentation API • Instrumentation code written in C/C++/asm • ATOM-like API, based on procedure calls • Instrumentation tools portable across platforms • Same tools work on IA32, EM64T (x86-64), Itanium, ARM • Same tools work on Linux and Windows (ongoing work) • Low instrumentation overhead • Pin automatically optimizes instrumentation code • Pin can attach instrumentation to a running process • Robust • Handle mixed code and data, variable-length instructions, dynamically-generated code • Transparent • Application sees original addresses, values, and stack content
Same source code works on the 4 architectures • => Pin takes care of different addressing modes • No need to manually save/restore application state • => Pin does it for you automatically and efficiently A Pintool for Tracing Memory Writes #include <iostream> #include "pin.H" FILE* trace; VOID RecordMemWrite(VOID* ip, VOID* addr, UINT32 size) { fprintf(trace, “%p: W %p %d\n”, ip, addr, size); } VOID Instruction(INS ins, VOID *v) { if (INS_IsMemoryWrite(ins)) INS_InsertCall(ins, IPOINT_BEFORE, AFUNPTR(RecordMemWrite), IARG_INST_PTR, IARG_MEMORYWRITE_EA, IARG_MEMORYWRITE_SIZE, IARG_END); } int main(int argc, char * argv[]) { PIN_Init(argc, argv); trace = fopen(“atrace.out”, “w”); INS_AddInstrumentFunction(Instruction, 0); PIN_StartProgram(); return 0; } executed immediately before a write is executed executed when an instruction is dynamically compiled
1’ 1 3 2 2’ 4 5 7’ 6 7 Dynamic Instrumentation Original code Code cache Exits point back to Pin Pin Pin fetches trace starting block 1 and start instrumentation
1’ 2’ 7’ Dynamic Instrumentation Original code Code cache 1 3 2 4 5 6 7 Pin Pin transfers control into code cache (block 1)
1’ 3’ 1 3 2 5’ 2’ 4 5 6’ 7’ 6 7 Dynamic Instrumentation Original code Code cache trace linking Pin Pin fetches and instrument a new trace
Application Operating System Hardware Pin’s Software Architecture Address space Pintool • 3 programs (Pin, Pintool, App) in same address space: • User-level only • Instrumentation APIs: • Through which Pintool communicates with Pin • JIT compiler: • Dynamically compile and instrument • Emulation unit: • Handle insts that can’t be directly executed (e.g., syscalls) • Code cache: • Store compiled code • => Coordinated by VM Pin Instrumentation APIs Virtual Machine (VM) Code Cache JIT Compiler Emulation Unit
Pin Internal Details • Loading of Pin, Pintool, & Application • An Improved Trace Linking Technique • Register Re-allocation • Instrumentation Optimizations • Multithreading Support
Register Re-allocation • Instrumented code needs extra registers. E.g.: • Virtual registers available to the tool • A virtual stack pointer pointing to the instrumentation stack • Many more … • Approaches to get extra registers: • Ad-hoc (e.g., DynamoRIO, Strata, DynInst) • Whenever you need a register, spill one and fill it afterward • Re-allocate all registers during compilation • Local allocation (e.g., Valgrind) • Allocate registers independently within each trace • Global allocation (Pin) • Allocate registers across traces (can be inter-procedural)
Virtual Virtual Physical Physical %eax %eax %eax %eax %ebx %ebx %edi %esi %ecx %ecx %ecx %ecx %edx %edx %edx %edx Valgrind’s Register Re-allocation Original Code Trace 1 mov 1, %eax mov 2, %esi cmp %ecx, %edx mov %eax, SPILLeax mov %esi, SPILLebx jz t’ mov 1, %eax mov 2, %ebx cmp %ecx, %edx jz t add 1, %eax sub 2, %ebx re-allocate t: Trace 2 t’: mov SPILLeax, %eax mov SPILLebx ,%edi add 1, %eax sub 2, %edi CSimple but inefficient • All modified registers are spilled at a trace’s end • Refill registers at a trace’s beginning
Original Code Trace 1 mov 1, %eax mov 2, %esi cmp %ecx, %edx jz t’ mov 1, %eax mov 2, %ebx cmp %ecx, %edx jz t add 1, %eax sub 2, %ebx re-allocate t: Trace 2 Virtual Physical %eax %eax t’: add 1, %eax sub 2, %esi %ebx %esi %ecx %ecx %edx %edx Pin’s Register Re-allocation Scenario (1): Compiling a new trace at a trace exit Compile Trace 2 using the binding at Trace 1’s exit: CNo spilling/filling needed across traces
Virtual Virtual Physical Physical %eax %eax %eax %eax %ebx %ebx %edi %esi %ecx %ecx %ecx %ecx %edx %edx %edx %edx Pin’s Register Re-allocation Scenario (2): Targeting an already generated trace at a trace exit Trace 1 (being compiled) Original Code mov 1, %eax mov 2, %esi cmp %ecx, %edx mov %esi, SPILLebx mov SPILLebx, %edi jz t’ mov 1, %eax mov 2, %ebx cmp %ecx, %edx jz t add 1, %eax sub 2, %ebx re-allocate t: Trace 2 (in code cache) t’: add 1, %eax sub 2, %edi CMinimal spilling/filling code
Instrumentation Optimizations • Inline instrumentation code into the application • Avoid saving/restoring eflags with liveness analysis • Schedule inlined instrumentation code
cmov %esi, %edi cmp %edi, (%esp) jle <target1> add %ecx, %edx cmp %edx, 0 je <target2> Example: Instruction Counting Original code BBL_InsertCall(bbl, IPOINT_BEFORE, docount(), IARG_UINT32, BBL_NumIns(bbl), IARG_END) C33 extra instructions executed altogether Instrument without applying any optimization bridge() Trace mov %esp,SPILLappsp mov SPILLpinsp,%esp call <bridge> cmov %esi, %edi mov SPILLappsp,%esp cmp %edi, (%esp) jle <target1’> pushf push %edx push %ecx push %eax movl 0x3, %eax call docount pop %eax pop %ecx pop %edx popf ret docount() add %eax,icount ret mov %esp,SPILLappsp mov SPILLpinsp,%esp call <bridge> add %ecx, %edx cmp %edx, 0 je <target2’>
cmov %esi, %edi cmp %edi, (%esp) jle <target1> add %ecx, %edx cmp %edx, 0 je <target2> Example: Instruction Counting Original code Inlining Trace mov %esp,SPILLappsp mov SPILLpinsp,%esp pushf add 0x3, icount popf cmov %esi, %edi mov SPILLappsp,%esp cmp %edi, (%esp) jle <target1’> C11 extra instructions executed mov %esp,SPILLappsp mov SPILLpinsp,%esp pushf add 0x3, icount popf add %ecx, %edx cmp %edx, 0 je <target2’>
cmov %esi, %edi cmp %edi, (%esp) jle <target1> add %ecx, %edx cmp %edx, 0 je <target2> add 0x3, icount add %ecx, %edx cmp %edx, 0 je <target2’> Example: Instruction Counting Original code Inlining + eflags liveness analysis Trace mov %esp,SPILLappsp mov SPILLpinsp,%esp pushf add 0x3, icount popf cmov %esi, %edi mov SPILLappsp,%esp cmp %edi, (%esp) jle <target1’> C7 extra instructions executed
cmov %esi, %edi cmp %edi, (%esp) jle <target1> add %ecx, %edx cmp %edx, 0 je <target2> add 0x3, icount add %ecx, %edx cmp %edx, 0 je <target2’> Example: Instruction Counting Original code Inlining + eflags liveness analysis + scheduling Trace cmov %esi, %edi add 0x3, icount cmp %edi, (%esp) jle <target1’> C2 extra instructions executed
Pin Instrumentation Performance Runtime overhead of basic-block counting with Pin on IA32 (SPEC2K using reference data sets)
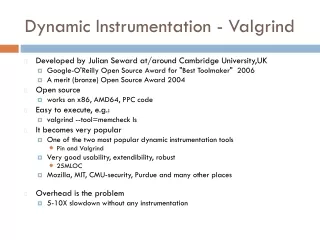
Comparison among Dynamic Instrumentation Tools Runtime overhead of basic-block counting with three different tools • Valgrind is a popular instrumentation tool on Linux • Call-based instrumentation, no inlining • DynamoRIO is the performance leader in binary dynamic optimization • Manually inline, no eflags liveness analysis and scheduling CPin automatically provides efficient instrumentation
Pin Applications • Sample tools in the Pin distribution: • Cache simulators, branch predictors, address tracer, syscall tracer, edge profiler, stride profiler • Some tools developed and used inside Intel: • Opcodemix (analyze code generated by compilers) • PinPoints (find representative regions in programs to simulate) • A tool for detecting memory bugs • Some companies are writing their own Pintools: • A major database vendor, a major search engine provider • Some universities using Pin in teaching and research: • U. of Colorado, MIT, Harvard, Princeton, U of Minnesota, Northeastern, Tufts, University of Rochester, …
Conclusions • Pin • A dynamic instrumentation system for building your own program analysis tools • Easy to use, robust, transparent, efficient • Tool source compatible on IA32, EM64T, Itanium, ARM • Works on large applications • database, search engine, web browsers, … • Available on Linux; Windows version coming soon • Downloadable from http://rogue.colorado.edu/Pin • User manual, many example tools, tutorials • 3300 downloads since 2004 July
Acknowledgments • Prof Dan Connors • Hosting Pin website at U of Colorado • Intel Bistro Team • Providing the Falcon decoder/encoder • Suggesting instrumentation scheduling • Mark Charney • Providing the XED decoder/encoder • Ramesh Peri • Implementing part of Itanium Instrumentation
Talk Outline • A Sample Pintool • Pin Internal Details • Experimental Results • Pin Applications • Conclusions
Trace Linking • Trace linking is a very effective optimization • Bypass VM when transferring from one trace to another • Slowdown without trace linking as much as 100x • Linking direct branches/calls • Straightforward as targets are unique • Linking indirect branches/calls & returns • More challenging because the target can be different each time • Our approach: • For all indirect control transfers, use chaining • For returns, further optimizes with function cloning
target_1’: if (T != target_1) jmp target_2’ … Indirect Trace Linking original indirect jump • Chains are built incrementally • Most recent target inserted at the chain’s head • Hash table is local to each indirect jump jmp [%eax] chain of predicted targets LookupHtab: target_N’: if (hit) jmp translated[T] else call Pin if (T != target_N) jmp LookupHtab … mov [%eax], T jmp target_1’ slow path CImproved prediction accuracy over existing schemes
A’: if (T != A) jmp B’ … pop T jmp A’ F(): F_B’(): F_A’(): A’: B’: F’(): ret pop T jmp A’ pop T jmp B’ if (T != A) jmp Lookuphtab1 … if (T != B) jmp Lookuphtab2 … B(): Return-Address Prediction • Distinguish different callers to a function by cloning: B’: if (T != B) jmp Lookuphtab1 … A(): no cloning call F() call F() cloning CPrediction accuracy further improved
Pin Multithreading Support • For instrumenting multithreaded programs: • Pin intercepts all threading-related system calls: • Create and start jitting a thread if a clone() is seen • Pin provides a “thread id” for pintools to index thread-local storage • Pin’s virtual registers are backed up by per-thread spilling area • For writing multithreaded pintools: • Since Pin cannot link in libpthread in the pintool (to avoid conflicts in setting up signal handlers by two libpthreads) • Pin implements a subset of libpthread itself • Pin can also redirect libpthread calls in pintool to the application’s libpthread
Instrumenting Multithreaded Programs • Pin instruments multithreaded programs: • Spilling area has to be thread local • Create a new per-thread spilling area when a thread-create system call (e.g., clone()) is intercepted • How to access to per-thread spilling area? • Steal a physical register to point to the per-thread spilling area • x86-specific optimization: • Initially assuming single-threaded program • Access to the spilling area via its absolute address • If multiple threads detected later: • Flush the code cache • Recompile with a physical register pointing to per-thread spilling area
Optimizing Instrumentation Performance Observations: • Slowdown largely due to executing instrumentation code rather than dynamic compilation • Make sense to spend more time to optimize • Focus on optimizing simple instrumentation tools: • Performance depends on how fast we can transit between the application and the tool • Simple yet commonly used (e.g., basic-block profiling)
Pin Source Code Organization • Pin source organized into generic, architecture-dependent, OS-dependent modules: C~50% code shared among architectures
Pin Instrumentation Performance Performance of basic-block counting with Pin/IA32
Comparison among Dynamic Instrumentation Tools Performance of basic-block counting with three different tools • Valgrind is a popular instrumentation tool on Linux • Call-based instrumentation, no inlining • DynamoRIO is the performance leader in dynamic optimization • Manually inline, no eflags liveness analysis and scheduling CPin automatically provides efficient instrumentation