Download

1 / 16
160 likes | 279 Views
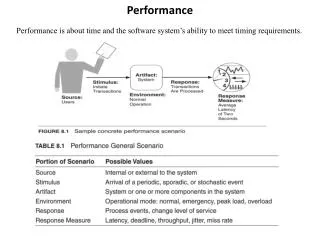
Performance PLG. Performance Report. 7 th September, 2011 Richard Wells, Head of Knowledge & Intelligence. A&E Performance – All types. Performance for the week ending 28/08/11 is 98.16% with two Trusts below 95% and two Trusts below 95% year to date.

E N D
Performance PLG Performance Report 7th September, 2011 Richard Wells, Head of Knowledge & Intelligence
A&E Performance – All types • Performance for the week ending 28/08/11 is 98.16% with two Trusts below 95% and two Trusts below 95% year to date. • Performance this week is 0.66% higher than the comparable week in 2010.
Patient Handover Times Week 14th Aug 2011 Category A Response Times - Provisional un-validated LAS Data Cat A within 8 mins: >75%, 70-75%, <70% Cat A within 19 mins: >95%, 90-95%, <90% % Handover Times over 15 mins: <15% Green, 15-20% Amber, >20% Red Average Handover Time Target: <12.5 Green, 12.5-15 Amber, >15 Red
18 Weeks waits data – July 2011 provisional Please note RAG rating has been applied against 11/12 thresholds
Referral to treatment: 95th Percentile trend data • The provisional data for July shows there are ten Trusts breaching the 95th percentile standard for admitted performance. Four Trusts have breached the median wait threshold supporting measure. • Two Trusts are performing above the non-admitted 95th percentile standard- Kingston Hospital and South London Healthcare. GOSH is currently above the median wait. • Six Trusts are above the incomplete 95th percentile and four Trusts are above the median wait. Orange line is a trend line - showing the 3 month rolling average.
Referral to treatment: specialty data Overall performance includes London’s independent Sector Providers
Diagnostics – July 2011 provisional The table above shows Trusts that have had over two diagnostic waits during the current or previous month. • Provisional July data shows an increase in 6-week waits compared to June 2011. (1146 compared to 1205)
Health Care Acquired Infections- Acute Trusts MRSA 25th August 2011
Venous Thromboembolism (VTE) June 2011 Percentage of adult patients admitted in the month, who were assessed for VTE on admission to hospital.
Health Checks Q1 2011/12 Proportion of eligible population offered a health check in Q1 2011/12