Download
1 / 9
90 likes | 192 Views
Quality control and interpolation of meteorological variables Gregor Vertačnik EARS, Department of Climatology. Overview. Monthly precipitation, climate and synoptic reports Digitalization Databases Quality control Daily precipitation q uality control and interpolation

E N D
Quality control and interpolation of meteorological variables Gregor Vertačnik EARS, Department of Climatology
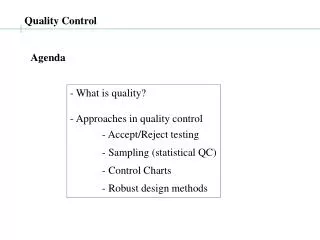
Overview • Monthly precipitation, climate and synoptic reports • Digitalization • Databases • Quality control • Daily precipitation quality control and interpolation • Solar irradiance quality control and interpolation
Monthly precipitation, climate and synoptic reports • special forms for manual observations : • precipitation (one sheet) • climatological (A4 diary) • synoptic (large diary) • monthly reports are sent by surface mail to EARS at the beginning of new month DODAJ SLIKE VSEH TREH DNEVNIKOV
Digitalization and data storage • manual entry of climatological data into database: • 13 synoptic station on daily basis • other stations on monthly basis • pluviograms and sunshine cards are digitazed by using “mouse clicking” method each month, other paper charts only if needed • SYNOP reports and data from automatic weather stations are automatically stored into database in near-real time DODAJ SLIKO DIGITALIZIRANJA Z MIŠKO IN MILANOVO KONTROLO NA EKRANU
Databases • data from weather stations and dataloggers are stored in Oracle and PostgreSQL relational database • digitazed data from paper charts are stored in VMS text-file archive and PostgreSQL relational database • PostgreSQL relational database working on Linux server contains all meteorological data (including radar measurements) except satellite data • two types of tables: • input data with original values • quality controlled and interpolated data for clients SLIKA BAZE?
Quality control • automatic half-hour data on daily basis, classical climatological data on mothly basis • very simple routine to check SYNOP data at the moment • automatic validation is done using programmes written in Fortran, Pascal (earlier versions) and PostgreSQL, Perl, PHP, other OpenSource tools (modern versions) • paper charts (thermograms, hgyrograms etc.) are mostly used to check manual measurements
hard limits check (for impossible values, eg. T > 50 °C) • soft limits check (within local extremes) • inner consistency tests (eg. Tmin <= Tmax), spatial consistency tests • test if values are within time series, searching for big jumps, variability tests • test with redundant instruments (eg. thermograph) • all data get quality flags
Daily precipitation data quality control and interpolation • manual Measurements of daily rainfall by Hellmann rain-gauge are both automatically and visually quality controlled • software for automatic validation is written in Perl and is running on Linux server • new, more complex and extended version of the software is in operational use since last year • precipitation data are checked with: • interpolated values using data from 10 “neighbouring” precipitation stations • automatic rain gauge data at the same station (if exists) • radar-measured rainfall data • spatial interpolation: • two results are given (one including all stations, other excluding up to two outliers) • inverse-square-distance method, normalized for monthly precipitation normals at the selected and neighbouring stations • software also returns a proposal on the basis of most common mistakes (missing digit, decimal point at wrong place etc.)
Solar irradiance quality control and interpolation • half-hour averages of global, diffuse and UVB irradiance • automatic validation by software written in Perl and running on Linux server • structure of the software: • extraterrestrial solar irradiance calculation for each half an hour’s interval • correction of diffuse irradiance data for shade ring • correction of all data for systematic offset (calculated from nocturnal values) • global and diffuse irradiance are validated by extraterrestrial irradiance • intercomparison of global and diffuse irradiance • UVB irradiance is checked with global and extraterrestrial irradiance • interpolation of missing and false data in time / space / by sunshine recorder data • all values are flagged using 16-bit flag system