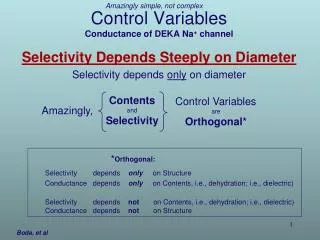
Control of Analytical Variables
560 likes | 1.78k Views
Control of Analytical Variables. Dr. Roula Hamid MSc Clin Biochem Central Puplic Health Laboratory QC Chemistry. Today is not the golden age of quality in healthcare laboratories. We can & should be doing the better. James O Westgard 2003. Introduction “Nice to Know”.

Control of Analytical Variables
E N D
Presentation Transcript
Control of Analytical Variables Dr. RoulaHamid MScClinBiochem Central Puplic Health Laboratory QC Chemistry
Today is not the golden age of quality in healthcare laboratories. We can & should be doing the better. James O Westgard 2003
Total Quality Management framework for management of quality in healthcare laboratories Goals, Objectives, Quality Riquirements
The “five-Q” framework defines how quality is managed objectively with the “scientific method” or the PDCA cycle
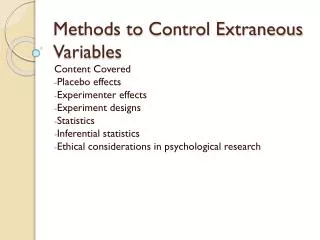
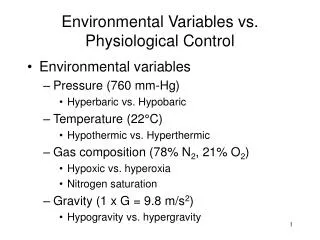
Analytical Variables must be controlled carefully to ensure accurate measurements by analytical methods
Documentation of analytical protocols • Monitoring technical competency • Statistical control of analytical methods • EQA • New quality initiatives
Documentation of Analytical Protocols • CLSI defines a process as a set of interrelated or interacting activities that transform input into output.
CLSI document describes the following section to be included in a laboratory procedure : • Title: clear & concise • Purpose or principle: e.g. this process describes how …., • Procedure instructions: how to do • Related documents:listing of other procedure • References: source of information • Appendixes or attachments • Auther(s): author(s) of document • Approved signatures
Monitoring Technical Competency • Proper training of laboratory personnel to establish uniformity in technique is important.
Statistical control of analytical methods • Control materials • General principles of control chart • Performance characteristics of a control procedures • Westgardmultirule chart • Identifying sources of analytical errors
Control materials • Specimens that are analyzed for QC purposes are known as control materials • They need to be available • In a stable form • In vial or aliquots • & for analysis over an extended period of time
General principles of control chart • A common method used to compare the values observed for control materials with their known values is the use of control charts
c) Precision problem; increase in standard deviation b) Accuracy problem; shift in mean a)Stable performance Control limit Control limit Figure: Conceptual basis of control charts. Frequency distributions of control observations for different error conditions
Figure: Conceptual basis of control charts. Frequency distributions of control observations for different error conditions
Performance characteristics of a control procedures The knowledge of performance characteristics of control procedures is necessory to select the control rules that detect relevent laboratory problems without causing too many false alarms
Westgardmultirule chart • The probability of false rejection is kept low through selection of only those rules with low • The probabilities for error detection is improved through selection of those rules that are particularly sensitive to random & systemic errors. • The use of multirule procedure is similar to the use of a Levey-Jennings chart, but the data interpretation is more structured.
To use the multirule procedure, the following steps are used :
Figure : Westgardmultirule chart with control limit drawn at the mean ± 1s, 2s & 3s. Chart for high concentration
Figure : Westgardmultirule chart with control limit drawn at the mean ± 1s, 2s & 3s. Chart for low concentration
EQA Procedures used to compare the performance of different laboratories (EQA)
Features of External Quality Assessment Programs • EQA program available to the clinical laboratories by professional societies & manufactures of control materials • All the participating laboratories analyzing the same lot of control material • Results are tabulated periodically & sent to the sponsering group for data analysis • The reports often includes extensive data analysis, statesical sumaries & plots
The mean of values of all laboratories is taken as the true or correct value & is used for comparision with the indivisual laboratory’s mean • Different approaches for data anaalysise.g. t-test, SDI,Youden plots & Levey-Jennings plots
New quality initiatives The six sigma process Lean production ISO 9000
The six sigma process • The six sigma control is an evolution in quality management • 6 sigma or 6 SD of process variation should fit within the tolerance limits for the process
- Tolerance specification + Tolerance specification Target -6s -5s -4s -3s -2s -1s 0s 1s 2s 3s 4s 5s 6s Figure : Six sigma goal for process performance “ tolerance specification” represents the quality requirements
Lean production • It is a quality process that is focused on creating more value by eliminating activities that are considered waste • e.g. Lean team at Saint Mary’s Hospital used lean production to improve the efficiency of its paper ordering system for lab work in their ICU.
ISO 9000 • The International Standard Organization (ISO) has developed the ISO 9000 standards • It is a set of 4 standards (ISO 9001-9004) enacted to ensure quality management & QA. • ISO 9000 represents an international consequence on the essential features of a QS to ensure the effective operation of an organization
Joint Committee for traceability in Laboratory Medicine The traceability of values assigned to calibrators &/or control materials must be assured through available reference measurement procedures &/or available reference materials of a higher order
True value Definitive method Primary reference material Method validation Reference method traceability Method validation, external quality control Secondary reference method Observed value Field method Figure: Structure of an accuracy based measurement system showing relationships among reference methods & materials Control material IQC
References Burtis,C.A., Ashwood,E.R. & Br uns,D.E. Fundamentals of Clinical Chemistry. 2008. .6th.ed. SAUNDERS ELSEVIER. P:249-262. Arneson,W. & Brichell,J. Clinical Chemistry ‘A Laboratory Perspective’. 2007. F. A. Davis Company. P:53-72. Westgard,J.O. Internal Quality Control: Planning & Implementation Strategies. 2003. Ann ClinBiochem. 40; 593-611.