Download

1 / 20
200 likes | 361 Views
Learning Connections Champions Conference. January 25 , 2008 York University. TinkerPlots and SmartBoards. Sharman Howes Numeracy Facilitator Learning Connections. Data has the capacity to reveal strength and weaknesses, failure and success. (Schmoker 1999, p.39).

E N D
Learning ConnectionsChampions Conference January 25 , 2008 York University
TinkerPlots and SmartBoards Sharman Howes Numeracy Facilitator Learning Connections
Data has the capacity to reveal strength and weaknesses, failure and success. (Schmoker 1999, p.39)
What is TinkerPlots ? • Dynamic statistical software • Developed for students Gr 4 – 8 • Referred to in Ontario Math curriculum • Allows students to use data to investigate and hypothesize
Features of TinkerPlots Software • Movies • Help files • Exploring Data Starters • Data and Demos
Sources of Data • Included in the software • Entered manually • Imported from other files such as Excel or internet site (EQAO)
Data can be acquired from: • EQAO/ IIR • Report cards • SIS • Manually entered • Any spreadsheet file
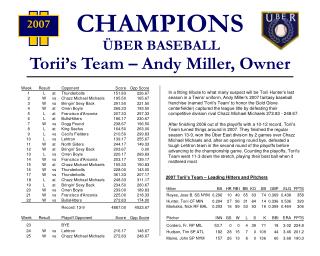
A student’s Data Card, that is analogous to a baseball card, showing standard grades like win-loss records, but also a variety of significant, specific indicators, interventions and results. (Wiggins, in Schmoker 1999, p.87
What can we celebrate? Alphakids June Alphakids Oct
Useful for Teachers • Teachers use of TinkerPlots, to build data walls and to help pose and answer questions about the data, would model student learning about data analysis.
Sources of data • Census at School • Statscan • Swivel.com • Gapminder.com • Notebook lessons
SMARTBoard An Interactive Whiteboard
SMART Board Tutorials • SMART Board • Powerpoint • Notebook Software
Many support sites exist • SMARTBoard Templates • www.pdtogo.com