Just Plain Data Analysis:
Explore common statistical fallacies in data-based public affairs writing and learn to compile, evaluate, and present numerical evidence to support political arguments. Discover threats to internal and external validity, graphical distortions, and CPI adjustments for inflation, enhancing your data interpretation skills.


Just Plain Data Analysis:
E N D
Presentation Transcript
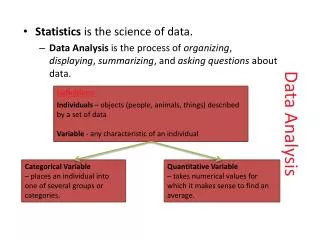
Just Plain Data Analysis: Compiling, evaluating, and presenting numerical evidence to support and illustrate arguments about politics and public affairs. • Numerical evidence: social, political and economic indicators • Arguments: “informal” arguments consisting of one or more premise and a conclusions.
Common Statistical Fallacies in the Interpretation of Social Indicators in Data-based Public Affairs Writing
A Statistical Fallacy: • A form of Inductive or Informal Argument Logical Fallacy: • When premises do not provide enough support for an argument’s conclusions. • Premises consist of time series, cross sectional and demographic numerical comparisons. • Note: Traditional hypothesis-testing research methods design defines a“deductive” argument structure, but only to establish a very limited conclusion.
The Ask a Stupic Question Fallacy: A new national survey by the Pew Research Center finds that nearly one-in-five Americans (18%) now say Obama is a Muslim, CNN/Opinion Research Corporation survey, more than a quarter of the public have doubts about Obama's citizenship
The Ask a Stupic Question Fallacy: More than half (51%) believe it is very likely or somewhat likely that government officials were "directly responsible for the assassination of President Kennedy.“ More than half (52%) believe it is likely that the CIA allowed drug dealers from Central America to sell crack cocaine to African-Americans in US inner cities.
The Ask a Stupic Question Fallacy: Nearly half (47%) believe it is very likely or somewhat likely that "The U.S. Air Force is withholding proof of the existence of intelligent life from other planets.”
Global Warming • Data in text file • Excel file: • http://lilt.ilstu.edu/gmklass/pos138/cherry2.xlsx
Other Denominator Misinterpretations • CPI adjustments for inflation overestimate inflation by %1 per year. Effect:: • Underestimates of income and price growth • Overestimates of poverty rates • “Percentage of median family income,” minimizes price increases, most commonly: • University tuition and fees as a percentage of median family income.
Threats to External Validity: • Treatment or Setting does not correspond to future policy • Hawthorne Effect • Multiple experimental treatments • Example: Third (rear window) brake light experiment • Example: Rats and cancer experiments
Rear window brake light experiment (1974): • 343 San Francisco taxicabs with CHMSL(Center High Mounted Stop Lamps) • 160 taxis with no additional light (random assignment) • Findings: CHMSL taxis:: 61% fewer rear end crashes, 61% fewer driver injuries, 62% lower repair costs • On all cars since 1986 • Later Finding: from 1989-95 CHMSLs reduced rear-end crashes by only 4.3%
Threats to Internal Validity All threats to internal validity are due to the lack of an equivalent or randomly assigned control group • History – something else happened at the same time to produce the effect • Maturation: long term processes affecting the results • Testing: the first test affects the scores on the second • Instrumentation: unreliable measures of effect
Threats to Internal Validity All threats to internal validity are due to the lack of an equivalent or randomly assigned control group • Instability: another form of unreliable measures • Regression artifact: Policy was conducted on a group, a place, or at a time chosen for its high or low scores on the test.Example: Murder rates are higher in states with the death penalty
Regression artifact: example • Students who do the best on the first exam usually do worse on the second • Students who do the worst on the first exam usually do better on the second
Examples • Rudi Giuliani and New York City’s Crime RateJPDA, pp 24-29 • Election Day RegistrationJPDA, pp 91-95
Election Day Registration Issue: Why do 6 states with EDR average about 10% higher voter turnout Possible Reasons • Reverse causation: states where civic participation is valued are more likely to enact EDR • History: • Those states may have had very closely contested elections • Those states may have other policies that encourage turnout
Election Day Registration Figure 4.7: State Voter Turnout* and Social Capital