Download
1 / 24
240 likes | 244 Views
Learn about water quality monitoring in California estuaries, including benthic invertebrates and their importance in the estuarine food web. Access reporting and management tools.

E N D
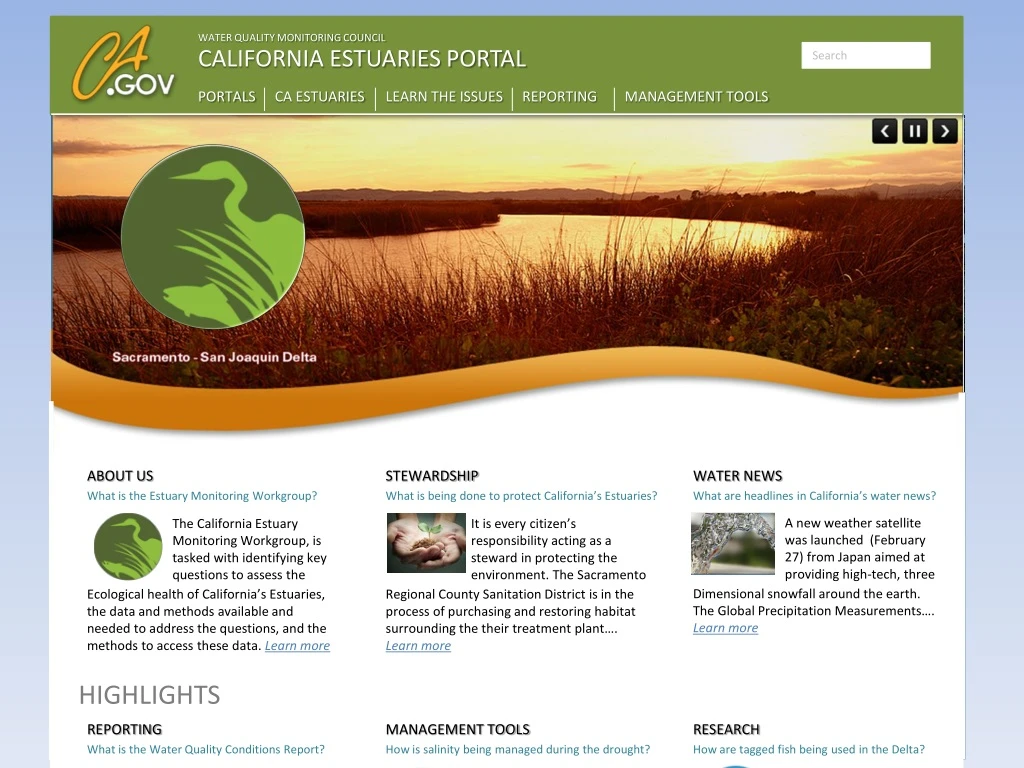
WATER QUALITY MONITORING COUNCIL CALIFORNIA ESTUARIES PORTAL Search PORTALS CA ESTUARIES LEARN THE ISSUES REPORTING MANAGEMENT TOOLS • San Francisco Estuary • Benthic Invertebrates • Santa Monica Bay • Elkhorn Slough • Morro Bay Estuary • Smith River Estuary • Klamath River Estuary • Mad River Estuary • Noyo River Estuary • Eel River Estuary • Russian River Estuary Safe ABOUT US STEWARDSHIP WATER NEWS What is the Estuary Monitoring Workgroup? What is being done to protect California’s Estuaries? What are headlines in California’s water news? A new weather satellite was launched (February 27) from Japan aimed at providing high-tech, three The California Estuary Monitoring Workgroup, is tasked with identifying key questions to assess the It is every citizen’s responsibility acting as a steward in protecting the environment. The Sacramento Dimensional snowfall around the earth. The Global Precipitation Measurements…. Learn more Ecological health of California’s Estuaries, the data and methods available and needed to address the questions, and the methods to access these data. Learn more Regional County Sanitation District is in the process of purchasing and restoring habitat surrounding the their treatment plant…. Learn more HIGHLIGHTS Safe REPORTING MANAGEMENT TOOLS RESEARCH What is the Water Quality Conditions Report? How is salinity being managed during the drought? How are tagged fish being used in the Delta? In support of various fish tracking studies by the Army Corp, USGS, MWD, DWR and participating This report summarizes the results of water quality monitoring and special studies conducted by the Building data stories to communicate complicated topics. Learn about Salinity, why it is important and the Agencies for management of receiver network ops and visualization of raw processed…. Learn more Environmental Monitoring Program within the Sacramento-San Joaquin Delta and Suisun Marsh, as mandated by Water Rights Decision 1641 (D-1641). Learn more Management options available to the resource agencies. See real time conductivity conditions, visualize the salt field and spatially view….. Learn more
WATER QUALITY MONITORING COUNCIL CALIFORNIA ESTUARIES PORTAL Search PORTALS CA ESTUARIES LEARN THE ISSUES REPORTING MANAGEMENT TOOLS Benthic Invertebrates How are they monitored? Reporting What Are they? SAN FRANCISCO BAY DELTA ESTUARY • Benthic organisms are creatures that live at the bottom of water bodies. They include common invertebrates (animals without backbones) like clams, shrimp, and crabs and other less recognized creatures including worms, little crustaceans called amphipods, and aquatic insects. These organisms live in or on the soft mud of the Estuary, while others attach themselves to rocks and other hard surfaces. There are also benthic vertebrates (animals with backbones) that include various fish species among other creatures. • Many benthic organisms are filter feeders. They pump water through their bodies or through holes they have burrowed in the mud to catch food suspended in the water. Others graze on food they find in and on the surface of the bottom. Filter feeders and grazers eat phytoplankton, zooplankton, other benthic organisms, and/or decaying organic debris washed in from the surrounding watershed. • Why Are Benthic Organisms Important? • Benthic organisms are important part of the estuarine food web. They consume and are consumed by other creatures. Every winter during low-tides, thousands of migrating shorebirds feast themselves upon uncovered clams, crabs, and worms found in the mudflats. Humans, as well, take advantage of the low-tides to harvest their own feast. Certain fish species, including juvenile salmon, striped bass, and sturgeon, also consume many types of benthic organisms. • A large percentage of the benthic organisms found in the SF Estuary are invasive and thus can have negative effects on the health of the estuary. • Filter feeding benthic organisms pump immense amounts of water through their bodies, consuming large amounts of the available phytoplankton biomass in the estuary. • Historically, bay shrimp supported a large commercial fishery in the Bay, and California’s commercial crab fishery still depends upon crabs that spend the first two years of their life growing in the SF Estuary. • Changes in benthic organisms’ populations also can be indications of larger changes in the physical conditions of the SF Estuary, including alterations in freshwater inflows, salinity, and sediment composition. These changes can then affect other living things and general water quality.
WATER QUALITY MONITORING COUNCIL CALIFORNIA ESTUARIES PORTAL Search PORTALS CA ESTUARIES LEARN THE ISSUES REPORTING MANAGEMENT TOOLS Benthic Invertebrates How are they monitored? Reporting What Are they? SAN FRANCISCO BAY DELTA ESTUARY Department of Water Resources Benthic Organism Study The California DWR Benthic Organism Study measures the composition (what kinds?), abundance (how many?), diversity (how many kinds?), and distribution (where are they?) of benthic organisms as part of the IEP’s Environmental Monitoring Program (EMP). Changes in their composition, abundance, diversity, and distribution are documented within the SF Estuary, from San Pablo Bay east through the upper Estuary to the mouths of the Sacramento, Mokelumne, and San Joaquin Rivers. Ten sites are currently sampled. Because different benthic species live in different parts of the Estuary, the sites represent a wide range of habitats of varying sizes and physical conditions, including different types of salinity and sediment composition. Sites range from narrow, freshwater channels in the Delta to broad, estuarine bays. Samples are collected monthly. From 1975 to 1979, biannual sampling was conducted in late spring and fall. Monthly sampling started in June 1980 and ended in October 2003. Samples were collected quarterly from October 2003 through October 2005, after which monthly sampling was resumed. Sediment samples are also collected at each site for sediment analysis. Learn more about the methods used to measure benthic organisms. Department of Fish and Wildlife San Francisco Bay Study EMP monitoring sites, however, are not as good for accurately sampling shrimp and crabs, but the CDFW San Francisco Bay Study surveys collect crabs and shrimp monthly using an otter trawl. Thirty-five fixed monitoring stations are distributed evenly throughout four sub-regions of the estuary, including South, Central, San Pablo, and Suisun Bays. More information on benthic organisms and their monitoring can be found in the DWR Benthic Organism Meta Data ,the Benthic BioGuide, the Benthic Dictionary, and the CDFW San Francisco Bay Study. For more information regarding sediment composition data, please contact Karen Gehrts. Rather than having interactive maps, users will select monitoring program to populate a static map above. To view the locations of phytoplankton and chlorophyll-a monitoring stations in the map above, please select: • Monitoring Program?
WATER QUALITY MONITORING COUNCIL CALIFORNIA ESTUARIES PORTAL Search PORTALS CA ESTUARIES LEARN THE ISSUES REPORTING MANAGEMENT TOOLS User’s will be able to access “Reporting” information and data in various ways. Benthic Invertebrates • SELECT DATA How are they monitored? • Where? Reporting What Are they? SAN FRANCISCO BAY DELTA ESTUARY • When? A brief introductory paragraph will be provided for D1641 (or other mandated reporting) • Water Rights Decision 1641 Compliance • The SWRCB establishes water quality objectives and monitoring plans to protect the variety of beneficial uses of the water within the upper San Francisco estuary (estuary). The SWRCB ensures that these objectives are met, in part, by inclusion of water quality monitoring requirements into water rights decisions issued to DWR and USBR as conditions for operating the SWP and CVP, respectively. These requirements include minimum outflows, limits to water diversion by the SWP and CVP, and maximum allowable salinity levels. In addition, DWR and USBR are required to conduct a comprehensive monitoring program to determine compliance with the water quality objectives and report the findings to the SWRCB. Water quality objectives were issued in December 1999 by D-1641 (SWRCB, 1999) and revised by order WR 2000-02 in March 2000. • 2015 Summary • The benthic monitoring program is designed to document the distribution, diversity, and abundance of benthic (bottom dwelling) organisms in the estuary. Geographic coverage of the sampling sites ranges from the eastern region of San Pablo Bay through the Delta to the mouths • of the Sacramento, Mokelumne, and San Joaquin rivers. The benthic community of the estuary is a diverse assemblage of organisms, which includes worms, crustaceans, insects, and molluscs. This program monitors both benthic macrofauna (organisms larger than 0.5 mm) and sediment composition (Lehman et al., 2001). General trends in sediment composition are documented at the same sites where benthic samples are collected. • To view prior year ‘s summaries or an archive of prior reports, please click here. • What Species? • Understanding the relative abundance and distribution of benthic invertebrates in the San Francisco Bay Delta Estuary. Station: D41 X Y The current year’s summary will be provided (updated annually). Users will be able access prior summaries and annual reports via link to (DWR?). • Species A • Species B • Count • Species C • Species D • Species E • Download: GraphDataMetadata Station: D28A X Y • Species A • Species B • Count • Species C • Species D • Species E • Download: GraphDataMetadata Station: P8 X Y • Species A • Species B • Count • Species C • Species D • Species E • Download: GraphDataMetadata
WATER QUALITY MONITORING COUNCIL CALIFORNIA ESTUARIES PORTAL Search PORTALS CA ESTUARIES LEARN THE ISSUES REPORTING MANAGEMENT TOOLS Zooplankton How are they monitored? Reporting What Are they? SAN FRANCISCO BAY DELTA ESTUARY • Zooplankton are small aquatic invertebrates (animals without backbones) that drift in the water with prevailing currents. Although they do not have the ability to swim against currents, they use behaviors such as vertical migration to maintain their approximate positions in the estuary. They include mysids (sometimes referred to as opossum shrimp because of the pouch they use to carry their eggs and their resemblance to tiny shrimp), some amphipods, copepods, cladocerans, and rotifers. • Zooplankton are pelagic and live in the open-water portions of the estuary, some are epibenthic and are found near the bottom of the water column, and some are associated with submerged aquatic vegetation and are found clinging to vegetation. Some zooplankton are grazers that eat phytoplankton, ciliates, and detritus. Other zooplankton are predatory and eat smaller zooplankton. • Why Are Zooplankton Important? • Zooplankton is an important component of the estuarine food web. They eat phytoplankton and in turn are eaten by other zooplankton, aquatic insects, and fish; thereby providing an important trophic link between primary producers and fish. Most larval and juvenile fish eat zooplankton and some smaller fish, such as Delta Smelt and Longfin Smelt, rely on zooplankton for food throughout their lives. • Most of the zooplankton in the upper San Francisco Estuary have declined in abundance since monitoring began in 1972, particularly native species. Currently most of the abundant zooplankton are non-native invasive species, some of which are not good fish food. • The introduced clam Potamocorbula amurensis drastically reduced the available phytoplankton in the low salinity zone of the estuary, which reduced food availability for zooplankton and caused many zooplankton species to decline. This resultant zooplankton decline has been implicated as one of the many causes of the Pelagic Organism Decline (POD), which described the dramatic decline of several pelagic fish species concurrently. • Changes in the abundance, distribution, and community composition of zooplankton in the estuary can be indications of larger changes in the physical conditions of the SF Estuary, including alterations in freshwater flows, salinity, and temperature. Species X
WATER QUALITY MONITORING COUNCIL CALIFORNIA ESTUARIES PORTAL Search PORTALS CA ESTUARIES LEARN THE ISSUES REPORTING MANAGEMENT TOOLS Zooplankton How are they monitored? Reporting What Are they? SAN FRANCISCO BAY DELTA ESTUARY Department of Fish and Wildlife’s Zooplankton Study The California Department of Fish and Wildlife’s Zooplankton Study determines the composition (what kinds?), abundance (how many?), and distribution (where are they?) of zooplankton in the upper San Francisco Estuary as part of the Interagency Ecological Program’s Environmental Monitoring Program (EMP). The Zooplankton Study monitors zooplankton in the upper San Francisco Estuary from San Pablo Bay east through the Delta. Between seventeen and twenty fixed sites are currently sampled monthly (Figure 1), depending on the electrical conductance of the water. Additional floating (non-fixed) sites are sampled in the entrapment zone; the locations of these sites varies monthly and is determined by the electrical conductivity of the water (a surrogate for salinity). Entrapment zone stations are sampled where the bottom electrical conductivity is two milliSiemens per centimeter and six milliSiemens per centimeter. When the entrapment zone is located upstream of the confluence of the Sacramento and San Joaquin rivers, the entrapment zones in each of these rivers are sampled separately. Since 1995, zooplankton samples from each site have been collected monthly during the DWR Water Quality Run. Prior to 1995, the winter months, December through February, were not always sampled. During some years from 1972 through 1993, the spring and summer months were sampled twice monthly. Water quality and phytoplankton samples are collected at each site. Three gear types are used at each sampling site to target different sizes of zooplankton: 1) a pump for sampling microzooplankton <1.0 mm long, including rotifers, copepod nauplii, and adult copepods of the genus Limnoithona; 2) a modified Clarke-Bumpus (CB) net for sampling mesozooplankton 0.5-3.0 mm long, including cladocerans, copepodids (immature copepods), and adult copepods; and 3) a macrozooplankton net for sampling zooplankton 1-20 mm long, which targets mysid shrimp. Learn more about the methods used to sample zooplankton. More information on zooplankton monitoring in the upper San Francisco Estuary can be found on the CDFW Zooplankton Study website, as well as the EMP Zooplankton Metadata. To view the locations of zooplankton monitoring stations in the map above, please select: • Monitoring Program?
WATER QUALITY MONITORING COUNCIL CALIFORNIA ESTUARIES PORTAL Search PORTALS CA ESTUARIES LEARN THE ISSUES REPORTING MANAGEMENT TOOLS 34N—need to figure out way of select data from multiple surveys, gear types etc. (zoo/fish data) Zooplankton • SELECT DATA How are they monitored? • Where? Reporting What Are they? SAN FRANCISCO BAY DELTA ESTUARY • When? • Water Rights Decision 1641 Compliance • The SWRCB establishes water quality objectives and monitoring plans to protect the variety of beneficial uses of the water within the upper San Francisco estuary (estuary). The SWRCB ensures that these objectives are met, in part, by inclusion of water quality monitoring requirements into water rights decisions issued to DWR and USBR as conditions for operating the SWP and CVP, respectively. These requirements include minimum outflows, limits to water diversion by the SWP and CVP, and maximum allowable salinity levels. In addition, DWR and USBR are required to conduct a comprehensive monitoring program to determine compliance with the water quality objectives and report the findings to the SWRCB. Water quality objectives were issued in December 1999 by D-1641 (SWRCB, 1999) and revised by order WR 2000-02 in March 2000. • 2015 Summary • The Zooplankton Study was designed to monitor the abundance and distribution of zooplankton in order to assess trends in fish food resources in the upper San Francisco Estuary. Geographic coverage of the sampling sites ranges from the eastern region of San Pablo Bay through the Delta. The zooplankton community is comprised of a diverse assemblage of organisms, which includes mysids, copepods, amphipods, cladocerans, and rotifers. • To view prior year ‘s summaries or an archive of prior reports, please click here. • What Species? • Understanding the relative abundance and distribution of Zooplankton in the San Francisco Bay Delta Estuary. Station: D41 X Y • Species A • Species B • Count • Species C • Species D • Species E • Download: GraphDataMetadata Station: D28A X Y • Species A • Species B • Count • Species C • Species D • Species E • Download: GraphDataMetadata Station: P8 X Y • Species A • Species B • Count • Species C • Species D • Species E • Download: GraphDataMetadata
WATER QUALITY MONITORING COUNCIL CALIFORNIA ESTUARIES PORTAL Search PORTALS CA ESTUARIES LEARN THE ISSUES REPORTING MANAGEMENT TOOLS Phytoplankton How are they monitored? Reporting What Are they? SAN FRANCISCO BAY DELTA ESTUARY • Phytoplankton are small organisms that can be found floating in most water bodies. Like plants, they are primary producers; they convert light energy from the sun and carbon dioxide into the living matter of their cells through photosynthesis. Phytoplankton from the San Francisco Estuary fall into four broad categories: cyanobacteria, diatoms, green algae, and various flagellate groups. • Why Are Phytoplankton Important? • Phytoplankton are the foundation of the aquatic food web. They feed a diverse array of organisms, ranging from microscopic zooplankton to large pelagic fish. Small fish and benthic organisms also graze on phytoplankton, and are in turn consumed by larger organisms such as birds. Changes in phytoplankton in the San Francisco Estuary can have cascading effects throughout the food web. • Phytoplankton can affect elements of water quality, including: • pH • Dissolved oxygen • Taste and odor of drinking water • Water transparency • Large algal blooms, both toxic and non-toxic, can have adverse effects on the water quality parameters listed above. They can also have negative aesthetic effects by forming large, floating surface scums. • Monitoring changes in phytoplankton can be useful in assessing water quality trends. It is important to note, however, that because of the transient and patchy nature of phytoplankton, their use as water quality indicators is limited and should be interpreted in conjunction with chemical, physical, and biological data. • Chlorophyll-a is the primary photosynthetic product made by phytoplankton and plants, and gives them their green color. Sometimes the green color is masked by secondary pigments, and these phytoplankton often appear brown or red instead of green.Chlorophyll-a is also a measure of the biomass that is directly available to organisms that prey on phytoplankton, such as clams and zooplankton.
WATER QUALITY MONITORING COUNCIL CALIFORNIA ESTUARIES PORTAL Search PORTALS CA ESTUARIES LEARN THE ISSUES REPORTING MANAGEMENT TOOLS Phytoplankton How are they monitored? Reporting What Are they? SAN FRANCISCO BAY DELTA ESTUARY Department of Water Resources Phytoplankton and Chlorophyll-a Monitoring The California DWR Phytoplankton and Chlorophyll-a Monitoring measures the composition (what kinds?), abundance (how many?), diversity (how many kinds?), and distribution (where are they?) of phytoplankton as part of the IEP’s Environmental Monitoring Program (EMP). It also measures phytoplankton biomass as chlorophyll-a. Changes in phytoplankton composition, abundance, diversity, distribution, and biomass are documented throughout the San Francisco Estuary, from San Pablo Bay east through the upper Estuary to the mouths of the Sacramento, Mokelumne, and San Joaquin Rivers. Thirteen fixed sites are currently sampled (Figure 1), with two additional sites sampled where the bottom specific conductance is 2,000 and 6,000 micro-Siemens, respectively. Specific conductance is used as a proxy for salinity, with higher values corresponding to higher salinity. The physical location of these sites varies based on where the target specific conductance values are found. Because different phytoplankton species live in different parts of the Estuary, the sites represent a wide range of habitats of varying physical conditions, including wide ranges of salinity and temperature. Sites range from narrow, freshwater channels in the Delta to broad, estuarine bays. Currently samples are collected monthly. Water is sampled from 1 meter below the surface. Whole water samples are collected for phytoplankton composition; water is filtered onto glass carbon fiber filters for chlorophyll-a analysis. Learn more about the methods used to analyze phytoplankton and chlorophyll-a. To view the locations of phytoplankton and chlorophyll-a monitoring stations in the map above, please select: • Monitoring Program?
WATER QUALITY MONITORING COUNCIL CALIFORNIA ESTUARIES PORTAL Search PORTALS CA ESTUARIES LEARN THE ISSUES REPORTING MANAGEMENT TOOLS Phytoplankton • SELECT DATA How are they monitored? • Where? Reporting What Are they? SAN FRANCISCO BAY DELTA ESTUARY • When? • Phytoplankton and Chlorophyll-a Monitoring • Phytoplankton samples are counted using an inverted microscope. Phytoplankton are identified to the lowest taxonomic level possible (usually genus or species) and counted. The counts are used to calculate organisms per milliliter. • There is often a large number of different genera and species in a single sample, so phytoplankton are usually grouped at a higher taxonomic level for reporting purposes (e.g. diatoms, cyanobacteria). While individual species can be restricted to certain habitats with specific physico-chemical characteristics, higher taxonomic groups such as diatoms are often widespread and cosmopolitan. • Chlorophyll-a varies widely throughout the San Francisco Estuary, and is affected by factors such as day length, temperature, nutrients, turbidity, and residence time (how long phytoplankton are in one location). In Suisun Bay, filtering by the clam Potamocorbulaamurensishas drastically altered the planktonic community since 1987, and chlorophyll-a levels in this region remain very low compared to other areas of the Estuary. • In some upstream areas of the Estuary, chlorophyll-a has increased in recent years, but still remains below historical levels. Chlorophyll-a below 10 µg/L is considered food-limiting for some zooplankton. • See more tools for exploring phytoplankton and chlorophyll-a data. • What Species? Tabs can be used to visualize additional data and figures. • Understanding the relative abundance and distribution of phytoplankton in the San Francisco Bay Delta Estuary. Station: D41 Phyto Chl-a • Species A • Species B • Count • Species C • Species D The default graph on page will be summary figure to accompany annual summary in text (TBD). Alternatively, users can load figures using the “select data” interface above. • Species E • Download: GraphDataMetadata Station: D28A Phyto Chl-a • Species A • Species B • Concentration • Species C • Species D • Species E • Download: GraphDataMetadata Station: P8 Phyto Chl-a • Species A • Species B • Count • Species C • Species D • Species E • Download: GraphDataMetadata
WATER QUALITY MONITORING COUNCIL CALIFORNIA ESTUARIES PORTAL Search PORTALS CA ESTUARIES LEARN THE ISSUES REPORTING MANAGEMENT TOOLS Fish How are they monitored? Reporting What Are they? SAN FRANCISCO BAY DELTA ESTUARY • The diverse habitats of SF Estuary support over 100 native and non-native species of fish. Although fishes demonstrate a wide spectrum of life-history characteristics, this portal groups species into the following categories: • Resident (the estuary is the primary residence habitat for all fish life stages) • Migratory (fish must transition between freshwater and the ocean to complete their life cycle) • Nursery (fish that reside primarily in the ocean as adults, but rear in the estuary) • Why Are Fish Important? • Fish in the SF Estuary are important for a variety of economic, cultural and ecological reasons. Recreational and commercial fisheries stimulate local economies. Commercially important fish include Chinook Salmon and Pacific Herring. Striped Bass and White Sturgeon are popular with sport anglers. Native Americans value fish resources such as Chinook Salmon and Pacific Lamprey for spiritual, cultural and economic purposes. A variety of species such as Northern Anchovy, smelts, herring, sculpins, and gobies serve an important role as forage species. Chinook Salmon adults provide nutrients as they decay in rivers after spawning. Measuring fish population size, distribution, or condition can be useful for monitoring changes within the estuary because fishes are responsive to changing environmental conditions. A large, divers fish assemblage that is distributed broadly throughout the estuary and dominated by native species is a good sign of a healthy estuary.
WATER QUALITY MONITORING COUNCIL CALIFORNIA ESTUARIES PORTAL Search PORTALS CA ESTUARIES LEARN THE ISSUES REPORTING MANAGEMENT TOOLS Fish How are they monitored? Reporting What Are they? SAN FRANCISCO BAY DELTA ESTUARY • The San Francisco Estuary fish fauna is surveyed regularly by numerous state and federally operated sampling programs. The methods used to survey fishes vary depending on fish behavior , fish size, and by the habitat (depth, substrate, vegetation) where they live. A list of the fish sampling programs are provided below (click for more information). New data sets are continuously uploaded to this portal as these data become available. • Learn more about the methods used to sample for fish in the San Francisco Estuary: • Year Round Surveys • San Francisco Bay Study (Bay Study) • Suisun Marsh Juvenile Fish Monitoring Survey • Fish Salvage Monitoring • Salmon Surveys • US Fish and Wildlife Service Surveys • Seasonal Surveys • Spring Kodiak Trawl • Smelt Larva Survey • 20 mm Survey • Summer Townet Survey • Fall Midwater Trawl Survey To view the locations of fish sampling stations in the map above, please select: • Monitoring Program?
WATER QUALITY MONITORING COUNCIL CALIFORNIA ESTUARIES PORTAL Search PORTALS CA ESTUARIES LEARN THE ISSUES REPORTING MANAGEMENT TOOLS How to label tab when no reporting is required? Fish • SELECT DATA How are they monitored? • Where? Reporting What Are they? SAN FRANCISCO BAY DELTA ESTUARY • When? • The status and trends of fishes in the San Francisco Estuary are reported using several measures of population health, including the following: • Abundance is a common indicator of population health. Scientists and managers rely on standardized abundance indices that reveal population trends over time. Abundance indices for many native species are in decline. • Species composition is an indicator of population and ecosystem health. In particular, the fraction of the total number of species in the estuary that are non-native is a measure of estuarine health; non-native species are more likely to become established in damaged ecosystems and may exacerbate impacts by eating or competing with native species. The San Francisco Estuary has been described as one of the most invaded estuaries on Earth. • Spatial distribution of key life history stages is another important measure of population health. For example, the number of rivers where migratory fish spawn is important because a limited spatial distribution increases the risk to a population from local, catastrophic disturbances such as chemical spills and disease outbreaks. To explore the spatial distribution of fish in the San Francisco Estuary, click here. • What Species? • Understanding the relative abundance and distribution of fish in the San Francisco Bay Delta Estuary. Station: X X Y • Species A • Species B • Count • Species C • Species D • Species E Refer to dashboards (under “Management Tools”) when other interfaces are available. • Download: GraphDataMetadata Station: Y X Y • Species A • Species B • Count • Species C • Species D • Species E • Download: GraphDataMetadata Station: Z X Y • Species A • Species B • Count • Species C • Species D • Species E • Download: GraphDataMetadata
WATER QUALITY MONITORING COUNCIL CALIFORNIA ESTUARIES PORTAL Search HOME CA ESTUARIES LEARN THE ISSUES STATUS AND TRENDS REPORTING MANAGEMENT TOOLS • San Francisco Estuary • Delta Juvenile Fish Monitoring Program • Water Quality • Restoration Tracking • Santa Monica Bay • Elkhorn Slough • Morro Bay Estuary • Smith River Estuary • Klamath River Estuary • Mad River Estuary • Noyo River Estuary • Eel River Estuary • Russian River Estuary Delta Juvenile Fish Monitoring Program Catch data will be presented spatially, allowing users to easily visualize data; users can view expanded content by selecting specific trawl locations Fish assemblage data will be available at specific locations in Delta within 3 days of sampling Water quality data will be presented along with catch data for the period of interest
WATER QUALITY MONITORING COUNCIL CALIFORNIA ESTUARIES PORTAL Search HOME CA ESTUARIES LEARN THE ISSUES STATUS AND TRENDS REPORTING MANAGEMENT TOOLS Delta Juvenile Fish Monitoring Program Catch data will be presented spatially, allowing users to easily visualize data; users can view expanded content by selecting specific trawl locations Fish assemblage data will be available at specific locations in Delta within 3 days of sampling Water quality data will be presented along with catch data for the period of interest
WATER QUALITY MONITORING COUNCIL CALIFORNIA ESTUARIES PORTAL Search HOME CA ESTUARIES LEARN THE ISSUES STATUS AND TRENDS REPORTING MANAGEMENT TOOLS Delta Juvenile Fish Monitoring Program Fish assemblage data will also be presented using bar or pie charts to illustrate relative abundance of species across the Delta for a period of interest.
WATER QUALITY MONITORING COUNCIL CALIFORNIA ESTUARIES PORTAL Search HOME CA ESTUARIES LEARN THE ISSUES STATUS AND TRENDS REPORTING MANAGEMENT TOOLS Water Quality Summaries will be presented regarding real time operations. Water quality maps will allow data visualization for: salinity, dissolved oxygen, turbidity, temperature etc. Long term trends for water quality data will be visualized for the period and constituent of interest.
WATER QUALITY MONITORING COUNCIL CALIFORNIA ESTUARIES PORTAL Search HOME CA ESTUARIES LEARN THE ISSUES STATUS AND TRENDS REPORTING MANAGEMENT TOOLS Restoration Tracking To track restoration efforts, users can select projects using the mapping interface GIS layers depict restoration status (e.g., planned, in progress, completed) Landscape Summary Monitoring Data Monitoring data will be displayed, illustrating trends pre- and post- restoration ZOOPLANKTON BIOMASS Summary statistics and data will be provided for the restoration project of interest
WATER QUALITY MONITORING COUNCIL MY WATER QUALITY Search HOME ABOUT US WORKGROUPS AND PORTALS PARTNERS REPORTING MANAGEMENT TOOLS The California Water Quality Monitoring Council’s My Water Quality web portals are supported by a wide variety of public and private organizations, presents California water quality monitoring data and assessment information that may be viewed across space and time. Initial web portal development concentrates on four them areas. Learn more Safe Is it Safe to Eat Fish and Shellfish From Our Waters? Is Our Water Safe to Drink? Is It Safe to Swim in Our Waters? Aquatic organisms are able to accumulate Safe drinking water depends on a variety of Swimming safety of our waters is linked to the certain pollutants from the water in which they live, sometimes reaching levels that could harm consumers. Learn more chemical and biological factors regulated by a number of local, state, and federal agencies. [Future Portal] levels of pathogens that have the potential to cause disease. Learn more Safe What Stressors and Processes Affect Our Water Quality? About Us Are Our Aquatic Ecosystems Healthy? The health of fish and other aquatic organisms and Beneficial uses of our waters are affected by emerging The Monitoring Council seeks to provide multiple perspectives on water quality information and to highlight existing data gaps communities depends on the chemical, physical, and biological quality of the waters in which they live. Learn more Contaminants, invasive species, trash, global warming, acidification, pollutant loads, and flow. Learn more and inconsistencies in data collection and interpretation. Learn more
WATER QUALITY MONITORING COUNCIL MY WATER QUALITY Search HOME ABOUT US WORKGROUPS AND PORTALS PARTNERS REPORTING MANAGEMENT TOOLS The Estuary Monitoring Workgroup has released the latest version of DWR’s Water Quality Conditions Report. Check out the new and improved interactive report, with increased access to real-time data from the Interagency Ecological Program’s Environmental Monitoring Program. Learn more Safe Is it Safe to Eat Fish and Shellfish From Our Waters? Is Our Water Safe to Drink? Is It Safe to Swim in Our Waters? Aquatic organisms are able to accumulate Safe drinking water depends on a variety of Swimming safety of our waters is linked to the certain pollutants from the water in which they live, sometimes reaching levels that could harm consumers. Learn more chemical and biological factors regulated by a number of local, state, and federal agencies. [Future Portal] levels of pathogens that have the potential to cause disease. Learn more Safe What Stressors and Processes Affect Our Water Quality? About Us Are Our Aquatic Ecosystems Healthy? The health of fish and other aquatic organisms and Beneficial uses of our waters are affected by emerging The Monitoring Council seeks to provide multiple perspectives on water quality information and to highlight existing data gaps communities depends on the chemical, physical, and biological quality of the waters in which they live. Learn more Contaminants, invasive species, trash, global warming, acidification, pollutant loads, and flow. Learn more and inconsistencies in data collection and interpretation. Learn more
WATER QUALITY MONITORING COUNCIL Wetland Monitoring Workgroup Search HOME CA ESTUARIES LEARN THE ISSUES STATUS AND TRENDS REPORTING MANAGEMENT TOOLS HIGHLIGHTS RESEARCH STEWARDSHIP ABOUT US Managing Salinity in a Drought Creating new, self sustaining The Estuaries Monitoring Workgroup Real-Time Acoustic Telemetry Data
WATER QUALITY MONITORING COUNCIL CALIFORNIA ESTUARIES PORTAL Search • San Francisco Estuary • Benthic Invertebrates • Santa Monica Bay • Elkhorn Slough • Morro Bay Estuary • Smith River Estuary • Klamath River Estuary • Mad River Estuary • Noyo River Estuary • Eel River Estuary • Russian River Estuary PORTALS CA ESTUARIES LEARN THE ISSUES REPORTING MANAGEMENT TOOLS Safe ABOUT US STEWARDSHIP WATER NEWS What is the Estuary Monitoring Workgroup? What is being done to protect California’s Estuaries? What are headlines in California’s water news? A new weather satellite was launched (February 27) from Japan aimed at providing high-tech, three The California Estuary Monitoring Workgroup, is tasked with identifying key questions to assess the It is every citizen’s responsibility acting as a steward in protecting the environment. The Sacramento Dimensional snowfall around the earth. The Global Precipitation Measurements…. Learn more Ecological health of California’s Estuaries, the data and methods available and needed to address the questions, and the methods to access these data. Learn more Regional County Sanitation District is in the process of purchasing and restoring habitat surrounding the their treatment plant…. Learn more Estuary Portal Homepage will highlight recent reports, e.g., SOTER HIGHLIGHTS Safe REPORTING MANAGEMENT TOOLS RESEARCH What is the State of the Estuary Report 2015? How is salinity being managed during the drought? How are tagged fish being used in the Delta? In support of various fish tracking studies by the Army Corp, USGS, MWD, DWR and participating The State of the Estuary Report is the most comprehensive health report ever completed for Building data stories to communicate complicated topics. Learn about Salinity, why it is important and the Agencies for management of receiver network ops and visualization of raw processed….. Learn more for the San Francisco Bay-Delta Estuary. It uses the best available science and most recent data contributed by over 30 scientists….. Learn more Management options available to the resource agencies. See real time conductivity conditions, visualize the salt field and spatially view….. Learn more
WATER QUALITY MONITORING COUNCIL CALIFORNIA ESTUARIES PORTAL Search • San Francisco Estuary • Benthic Invertebrates • Santa Monica Bay • Elkhorn Slough • Morro Bay Estuary • Smith River Estuary • Klamath River Estuary • Mad River Estuary • Noyo River Estuary • Eel River Estuary • Russian River Estuary PORTALS CA ESTUARIES LEARN THE ISSUES REPORTING MANAGEMENT TOOLS Users can access information/links regarding Bay-Delta Programs and Resources Programs & Resources Monitoring Programs [DESCRIPTIVE TEXT] • CA Department of Fish and Wildlife • CA Department of Pesticide Regulation • CA Department of Water Resources • California Estuary Monitoring Workgroup • Interagency Ecological Program • Irrigated Lands Regulatory Program • Point Blue Conservation Science (PRBO) • San Francisco Bay Bird Observatory • San Francisco Bay Joint Venture • San Francisco Bay Regional Monitoring Program • San Francisco Estuary Invasive Spartina Project • Surface Water Ambient Monitoring Program • U.S. Fish and Wildlife Service • U.S. Geological Survey Data Sources [DESCRIPTIVE TEXT] • CA Environmental Data Exchange Network (CEDEN) • CA Data Exchange Center (CDEC) • CA Department of Water Resources Water Data Library • CA Department of Fish and Wildlife BIOS • CA Avian Data Center • CA Partners in Flight • CalFish • U.S. Geological Survey National Water Information System • U.S. Environmental Protection Agency STORET and Water Quality Exchange SOTE Report can be accessed via link, which will take users to landing page. Reports [DESCRIPTIVE TEXT] Delta San Francisco Bay • Bay-Delta Strategic Workplan • CA Department of Fish and Wildlife Ecosystem Restoration Program Conservation Strategy • Delta Atlas • Delta Historical Ecology Study • Delta Science Plan • Delta Vision Foundation Report Card • Pelagic Organism Decline Reports • Public Policy Institute of California Reports • Pulse of the Delta • The State of the Bay-Delta, 2008 • National Coastal Conditions Reports • Pulse of the Estuary • San Francisco Estuary Partnership Comprehensive Conservation Management Program • San Francisco Habitat Goals Projects • State of the Estuary Report • State of the Birds Report
WATER QUALITY MONITORING COUNCIL CALIFORNIA ESTUARIES PORTAL Search • San Francisco Estuary • Benthic Invertebrates • Santa Monica Bay • Elkhorn Slough • Morro Bay Estuary • Smith River Estuary • Klamath River Estuary • Mad River Estuary • Noyo River Estuary • Eel River Estuary • Russian River Estuary PORTALS CA ESTUARIES LEARN THE ISSUES REPORTING MANAGEMENT TOOLS SOTER landing page, will provide 1) a brief description of the report; 2) ways to access the full report; and 3) links to the data on the portal used to develop indicators. State of the Estuary Report 2015 The State of the Estuary Report is the most comprehensive health report ever completed for the San Francisco Bay-Delta Estuary. It uses the best available science and most recent data contributed by over 30 scientists to assess the status of various parts of the ecosystem. The purpose is to identify problems with estuarine health, so that conservation and restoration efforts can focus on solutions. This 2015 report expands on the scope of its predecessor in 2011, including Delta indicators for the first time, various new indicators for San Francisco Bay, and new sections linking the Estuary to the Gulf of the Farallones. The results show that the Upper Estuary (Suisun Bay and the Delta) is in critical condition. San Francisco Bay is in better health but jeopardized by climate change. Immediate action, significant investment, and bold changes to status quo management will be needed if we choose to recover and maintain a healthy estuary. To learn more about the report, click here. • Accessing the Report • TheReport as a Flipbook – the flipbook integrates features such as text searching, bookmarking, and new enhancements, such as interactive charts and data stories. • The report as a PDF • The Executive Summary as a PDF • California Estuary Monitoring Workgroup’s Contributions • Through a collaborative effort, the California Estuary Monitoring Workgroup (CEMW) contributed to the development of the State of the Estuary Report 2015. CEMW members developed indicators, which assessed the status and trends for benthic invertebrates and zooplankton living in the San Francisco Bay-Delta Estuary. Data used to develop these indicators can be accessed through the Estuary Portal via the: • Benthic Invertebrate pages • Zooplankton pages