Download
1 / 29
290 likes | 305 Views
Learn how to map language distribution, income levels, spendings, and more in Toronto using SimplyMap. Access the tool, create maps, tables, and reports for insightful data analysis.

E N D
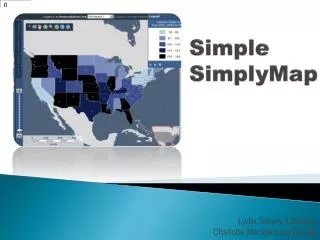
SimplyMap 2.0 November 8, 2011 Janina Mueller
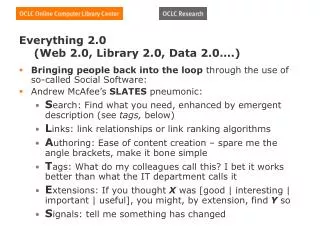
Accessing SimplyMap • Web browser • Sign up for an account (either through library website or www.simplymap.com) • We have 5 seats on SimplyMap • SimplyMap logs out automatically
Creating a Map Exercise 1 Map the % of a particular language, spoken at home, to the CMA of Toronto
Map Ranking Exercise 2 Create a table from the map you just created displaying the language variable by census tract AND Export the table into Excel
Data Filter Exercise 3 Median total income by CT in Toronto filtered by 1% of PhDs AND export as pdf
Look up and map filter variable Because it has to be in the list of recent variables
Mapping Points Exercise 4 Add hotel points to the map you just created
Location Analysis Report Exercise 5 Create a table comparing the average expenditures on (a) food and (b) women’s clothing in the CMA of Toronto (and CMA of Fredericton)
To add CMA of Fredericton 1 2: Display it 3: Go back to location 4. Create Combination Location; name it
Ring Study Report Exercise 6: Create a table and a map showing the average expenditure of food for DAs within a 5km radius of CT0004.00
SimplyMap Handout To access a handout that shows some of SimplyMaps features in greater detail, go to: 1) www.mdl.utoronto.ca 2) Search the Geospatial (GIS) Data Inventory 3) Type ‘workshop’ into search box 4) Click on GIS Tutorial U of T