Download
1 / 74
740 likes | 760 Views
This study explores the impact of different mathematics curricula on student achievement and classroom environments in middle and high school settings. Learn about the design considerations, challenges faced, recent findings, and implications for education. The research examines the influence of district-adopted textbooks, curriculum types, and implementation on student learning outcomes over a two-year period. Discover the unique insights gained from diverse samples and various curriculum approaches.

E N D
Longitudinal Studies of Curricular Effectiveness: Design Considerations, Challenges, Recent Findings, and Implications Dr. James E. Tarr, Ph.D. National Pingtung University of Education Pingtung, Taiwan November 19, 2013
National Science Foundation (NSF) funded Curricula for Middle Grades
Background • “In recent years mathematics curricula have been a topic of significant controversy. The strongest challenge to the domination of the traditional curriculum has come, in the past decade, from what are generally called reform or standards-based mathematics curricula… Advocates of the traditional curriculum fear that the reform curricula have thrown out the mathematical baby with the bath water… that they do not establish the firm mathematical foundations required for successful applications of the mathematics” (Schoenfeld, 2006, p. 8).
Research Questions • Are there differences in the implementation of district-adopted textbooks by curriculum type (NSF-funded vs. publisher-developed)? • What is the impact of district-adopted textbooks on the classroom learning environment and to what extent does a standards-based learning environment predict student achievement in mathematics? • In classrooms where district-adopted textbooks are a strong determinant of the content and activity of mathematics lessons, to what extent does curriculum type (NSF-funded vs. publisher-developed) predict student achievement?
Design and Sample • 2-year longitudinal study (Grades 67 and Grades 78) • Quasi-experimental design • 11 middle schools • 44 to 54 middle grades mathematics teachers each year (all teachers in grades 6, 7 & 8) • Over 4200 students (all students in grades 6, 7, & 8) • Demographic Diversity: Urban, Suburban, Small and Rural districts, and a range of percentages of minority and FRL populations across sample • Geographic Diversity: 6 states (Iowa, Minnesota, Washington, South Dakota, Colorado, Missouri) • Diversity of Textbooks: 6 NSF-funded curricula (2 CMP, 2 MiC, 2 MT) and 5 Publisher-developed curricula (Addison-Wesley, Glencoe, H-M, Saxon, SW, HB)
National Science Foundation (NSF) funded Curriculum for High School: Integrated Math
The COSMIC Project • A quasi-experimental longitudinal study funded by the National Science Foundation to the University of Missouri. • Evaluating high school students’ mathematics learning from textbooks embodying two distinct approaches to content organization: an Integrated approach (Core-Plus Mathematics Project) and a Subject-Specific approach (students follow an Algebra I, Geometry, Algebra II sequence). • To understand how student learning is impacted by curriculum materials, one must also understand how the curriculum is enacted in classroom by high school teachers.
Research Questions • Are there differential effects on high school students’ mathematics learning when they study from an integrated textbook and when students study from a subject-specific textbook? In particular, are there differential curricular effects with respect to student performance on: • Test of Common Textbook Objectives? • Mathematical Reasoning? • Mathematics Concepts and Problem Solving? • What are the relationships between student characteristics, curriculum type, curriculum implementation, and student learning? • What student characteristics are associated with high school students’ mathematics learning? • To what degree is curriculum type is associated with high school students’ mathematics learning? • What curriculum implementation factors are associated with high school students’ mathematics learning?
COSMIC Sample Textbooks • Integrated (INT) Program: Core-Plus • Subject-Specific (SS): various programs Schools • 11 schools in 5 geographically-dispersed states • Dual curricular options in place • Student choice between options (no tracking) Teachers • 107 teachers across the first two years • 326 classroom visits Students • More than 4,000
Research Challenge: Curriculum Research in a Highly-Political School Climate “On the other hand, NCLB (2002) has placed more demands on an already over-burdened teaching and administrative workforce…A primary tenet of NCLB is for ‘stronger accountability,’ including the mandate that all school districts formulate and disseminate annual ‘local report cards’ that include information on how students in the district and in each school performed on state assessments.” (Chval, Reys, Reys, Tarr, & Chavez, 2006, p. 159).
Research Challenge: Curriculum Research in a Highly-Political School Climate In (MS)2 and COSMIC projects, we were challenged by… • Highly-charged political school climate • “Will data be anonymous and confidential?” • Winners vs. losers • “What’s in it for us?” • Burden of additional assessments • Loss of instructional time In COSMIC project, the challenge of locating schools offering dual curriculum paths
On Evaluating Curricular Effectiveness “A standard for evaluation of any social program requires that an impact assessment is warranted only if two conditions are met: (1) the curricular program is clearly specified, and (2) the intervention is well implemented. Absent this assurance, one must have a means of ensuring or measuring treatment integrityin order to make causal inferences” (National Research Council, 2004, p. 100).
Characterizing Implementation Fidelity: • Course-Level • Lesson-Level
Documenting Curriculum Implementation Teacher Surveys • Adapted from 2000 National Mathematics and Science Survey (Horizon Research, Inc.) Textbook-Use Diaries • Designed to measure teachers’ use of curricular materials for particular topics Table-of-Contents Implementation Record • Designed to measure extent of coverage and students’ opportunity to learn from the textbook Classroom Visit Protocols • Curriculum-specific, based on interviews with textbook authors; other portions adapted from Wisconsin Longitudinal Study (Romberg & Shafer, 1998) and Middle School Mathematics Study (Reys, Reys, Tarr, & Chávez, 2004) District Personnel Interview Protocol • Developed by project staff
Course-level Implementation: Table of Contents Record Taught content ✔ ✔ ✔ ✔ ✔ ✔ ✔ ✔
Opportunity to Learn (OTL) Index: Example Indicates whether the textbook content was being taught or not taught Black = taught White = not taught
Summary: Course-level Implementation • On average, teachers cover approximately 75% of their textbook. • Teachers of Integrated textbooks tend to “cover” a smaller proportion of their textbook than teachers of Subject-Specific textbooks. • Teachers of Integrated curriculum vary more in their coverage of the content of textbook but when they do cover the content, they tend to follow the book more closely than those teaching Subject-Specific curricula.
Implementation Indices Six variables comprised the Implementation Indices: • From Textbook-Use Diaries: • Percent of lessons for which the textbook was used by the teacher as the primary resource in planning and implementing instruction • Percent of lessons for which the textbook was used by students during instruction • Percent of lessons for which homework was assigned from the textbook • From Observational Data: • Influence of textbook on the content of lessons taught • Influence of textbook on the presentation on lessons taught • From Table-of-Contents Implementation Records: • Percent of the textbook is “covered” over the course of a year (extent of coverage) Implementation indices were used to determine what teachers’ data could be included in the analysis in order to establish links between curriculum and student learning outcomes
Level-level Implementation: Textbook-specific Classroom Visit Protocols • We interviewed textbook authors and asked them to describe specific observable teacher behaviors they would expect to see in a faithful implementation of their curriculum materials. • Protocols required dichotomous judgments, “Did I observe this action?” or “Did I not observe this action?” • Codes were used to assign global scores on a 5-point Likert scale for: • Content Fidelity(the extent do high school mathematics teachers teach the content in their textbooks in their daily lessons); and • Presentation Fidelity(the extent do high school mathematics teachers use their textbook in their daily lessons in a way consistent with the pedagogical philosophy of the textbook).
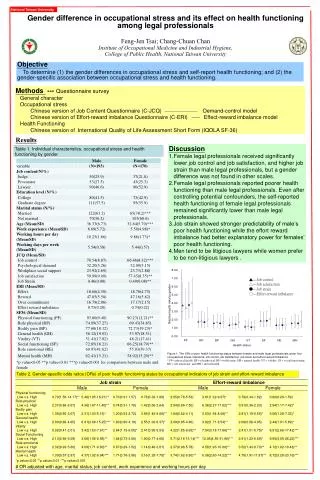
Content and Presentation Fidelity Ratings • Mean Presentation Fidelity rating is significantly lower than Mean Content Fidelity rating for ALL (p < .001), INT (p < .001), and SS (p < .05) • This result suggests that the manner in which each lesson was taught was less consistent with the author’s expectation than was the content of lessons taught.
Measuring a Standards-Based Learning Environments (SBLE) Classroom Observations • The enacted lesson provided opportunities for students to make conjectures about mathematical ideas. • The enacted lesson fostered the development of conceptual understanding. • Students explained their responses or solution strategies. • Multiple perspectives/strategies were encouraged and valued. • Students’ statements about mathematics were valued and used to build discussion or work toward shared understanding for the class.
Sample Rubric Students explained their responses or solution strategies. • The teacher generally did not encourage students to elaborate on answers or solution strategies. Rather, students simply stated answers to problems or questions posed by the teacher and the teacher accepted these answers without further probing. • The teacher sometimes encouraged students to explain how they arrived at an answer, but these explanations generally focused on the execution of procedures for solving problems rather than an elaboration on their thinking and solution path. • The teacher generally encouraged students to explain their responses or solution strategies. Although this was not the case for every student response, students did have opportunities to elaborate on their solution strategies orally or in written form by justifying their approach to a problem, explaining their thinking, or supporting their results.
Standards-Based Learning Environment • Predict the extent to which teachers provided a “standards-based learning environment” • Do you expect generally high ratings, generally low ratings, or somewhere in between? • How much variation in standards-based learning environment do you expect? • How much variation might we find in Taiwanese classrooms?
Selected Elements of the Classroom Learning Environment (CLE) Research Question: • What are particular characteristics of the classroom learning environment, independent of curriculum implementation? Ten elements in three themes: • Reasoning about Mathematics • Students’ Thinking in Instruction • Focus on Sense-making Each item was coded on scale from 1 (low) to 5 (high)
Inter-rater Reliability • 17 lessons were observed by two team members and each determined their own code • Results: • 89.4% of all pairs of CLE codes were within one point of each other • 55.3% of all pairs of CLE codes matched exactly
Research Challenges: Developing a Concise Protocol, Training Observers, andScheduling Classroom Visits • Developing a Protocol that could be coded in “real time” • Our mathematician held a different perspective on at least one of the 10 selected elements of the CLE • How many observations are sufficient? • Difficulties in scheduling multiple observations in schools in which we were “strangers” • Teachers’ anxiety about being observed • Teachers’ eagerness to receive feedback/evaluation
Reasoning About Mathematics • Students afforded opportunities to make conjectures about mathematical ideas. • Students’ arguments or justifications were challenged by others. • Mathematical authority rested with students.
Students’ Thinking in Mathematics • Formative assessment techniques were used to guide instructional decision making. • Students’ statements about mathematics were used to build shared understanding. • Student misconceptions or mistakes were used as a learning site for others.
Focus on Sense-Making • Multiple (alternative) solution strategies were encouraged. • The enacted lesson developed procedural knowledge in meaningful ways. • The enacted lesson developed conceptual understanding of mathematics. • Connections within mathematics were explored.
Summary Results: Sub-scores
Results: Interpretation • Overall means in Integrated lessons are higher than Subject Specific lessons. • Means are higher in Integrated lessons than Subject-Specific lessons in all 3 themes as well as all 10 items. • Means for Reasoning about Mathematics are lower than Students’ Thinking in Instruction and Focus on Sense-making. • No means were in the upper half of the 1 to 5 scale, leading us to write: “Such low scores for CLE subscales are consistent with results of the TIMSS Video Study (Jacobs et al., 2006), which found that typical mathematics teaching in the United States in both 1995 and 1999 ‘reflects the kind of traditional teaching that has been documented during most of the past century (Cuban, 1993; Fey, 1979; Hoetker & Ahlbrand, 1969; Welch, 1978), more so than the kind of teaching recommended in Principles and Standards.’ (pp. 28–29).” (Tarr et al., 2013, p. 720).
Research Challenges: Missing Data and “Too Much” Data • Missing Data and Attrition • Students’ Prior Achievement Score • Students’ Free or Reduced Lunch (FRL) Status • Students Participating in fewer than 3 years • Lack of Observational Data in Year 3 • One school dropped the Integrated option in Year 3 • “Too Much” Data • Is it possible to have too much data?