RADIATION DOSE ISSUES
Learn about exposure, absorbed radiation dose, effective dose, CT dose, dose variations, dose measurements, and factors affecting CT dose in medical imaging technologies. Gain insights on terminology, units, methods, and considerations for optimizing patient safety.

RADIATION DOSE ISSUES
E N D
Presentation Transcript
Exposure November 2002 RadioGraphics, 22, 1541-1553 • The term exposure describes the ability of x rays to ionize air. • It is measured in roentgens (R); this unit is defined as the quantity of x rays that produces 2.580 × 10⁻⁴ C of charge collected per unit mass (kilograms) of air at standard temperature and pressure (STP): • 1 R = 0.000258 C/kg air. It describes how much ionization is present in the volume, but it does not tell how much energy is absorbed by the tissues being irradiated.
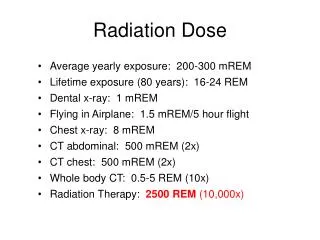
Absorbed Radiation Dose • describes the amount of energy absorbed per unit mass at a specific point. • It is measured in grays (1 Gy = 1 J/kg) or • rads (1 rad = 100 erg/g). • 100 rad = 1 Gy. • Absorbed dose essentially describes how much energy from ionizing radiation has been absorbed in a small volume centered at a point • it does not describe where that radiation dose is absorbed or reflect the relative radiosensitivity or risk of detriment to those tissues being irradiated.
Effective Dose E = effective dose, T-tissue, wT- tissue weighting factor, wR - radiation weighting factor, DT,R – average absorbed dose • takes into account where the radiation dose is being absorbed (eg, which tissue has absorbed that radiation dose) • It is a weighted average of organ doses, as described in Publication 60 of theInternational Commission on Radiological Protection (ICRP) • Unit is the Sievert (Sv) or rem. • 100 rem = 1 Sv.
CT dose Due to CT geometry dose estimation needs specialized methods In CT the dose is continuous and around the patient, not projectional There are multiple repeated exposures of an area during the scan There are multiple scans
Dose differences within a section In projectional radiography there is entry and exit side of the patient. The dose is higher to the skin at the entry and less at the exit. In CT the tube rotates 360°around the patient and dose is symmetrically distributed from the periphery to the centre There is a dose gradient from the periphery to the centre
The slope of the gradient depends on • The size of the object • The radiation spectrum • The degree of attenuation by tissues
Large part of anatomy • 32-cm phantom one detector row • 2:1 radiation dose difference • 120 kVp, • 280 mA, • 1-sec rotation time (280 mAs), • 10-mm slice thickness
Small part of anatomy • 16-cm phantom one detector row • No dose difference • 120 kVp, • 300 mA, • 1-sec rotation time • 5mm slice thickness
Z-axis • Apart from dose variations within a section there are differences along the Z- axis • They describe the dose outside a section due to single tube rotation • Radiation affects tissues at the section neibourghood because • There is no ideal beam collimation and • There is scatter generated within the patient • A series of sections add up to make the total dose
Dose histogram from a single tube rotation at the scanner isocenter Z-axis
Isocenter, where the central lines of the beam dissect • In CT the isocenter is in the center of the gantry opening
Therefore • The dose in a section is the sum of the dose that produces the section image and the dose the section absorbs when the surrounding sections are taken • The stray dose depends on: • Distance between sections • Section thickness • Shape of the beam
Ion chamber • Measures radiation >10 keV • It contains air • Closed cylinder with a positive (anode) an a negative (cathode) electrode. Potential difference applied in between them • The radiation causes ionization and the amount measured by the instrument
Dose measurements CT specific • Multiple Scan Average Dose (MSAD) • The average dose from a series of scans over an interval in length • Computed Tomography Dose Index • CTDI100- dose over 100mm length of ion chamber • CTDIw – weighted average between peripheral and central distribution • CTDIvol – takes into account protocol parameters like pitch for spiral scans or acquisition spacing for axial scans.
CTDIvol One final CTDI descriptor takes into account the parameters that are related to a specific imaging protocol, the helical pitch or axial scan spacing where N and T are as defined earlier and represent the total collimated width of the x-ray beam and I is the table travel per rotation for a helical scan or the spacing between acquisitions for axial scans.
Phantoms only partly reflect reality They produce estimations and not exact measurements They don’t take into account specific tissue sensitivity
Factors that affect CT dose • Direct effect • kilovolt peak • Milliamperes • Rotation time • Section thickness • Subject thickness • Pitch • Dose modulation techniques • Tube – isocenter distance • Indirect effect • Affect the image quality and indirectly the dose, i.e. reconstruction algorithms
kVp • Radiographer's choice • Affected by tube filtration • 120 to 140kVp≈ 35% increase in dose
mAs • mA • rotation time • Linear dose increase • mAs=effectivemAs = mA Χ time/pitch • When using effmAs changing one of the parameters automatically affects the others to keep effmAs constant.
Pitch • Table movement in 360° / section thickness • Increasing the pitchreduces dose • CTDIvol the only marker taking into account pitch
Section Thickness – Single detector scanner Dose in single section scanner with thickness change only Section thickness affects dose For thicker section more photons will pass through the patient because of wider collimation all other parameters kept stable. BUT ….. Exposure and adsorbed dose depend on the irradiated mass and in thicker sections more mass is irradiated so doses may be almost equivalent There is however more dose overlap for thin sections.
Section thickness– Multislice CT • Dose depends on beam thickness and not on the thickness of the reconstructed image. All other factors kept stable this may mean an increase up to 50% for smaller beam width. • As seen on table below a 5mm section can be reconstructed from • 4 × 1.25 mm • 4 × 2.5 mm • 4 × 5 mm but CTDI is stable
Patient size • All parameters stable the smaller object absorbs more radiation. • This is extremely important for the paediatric patient • It is due to the fact that the body is exposed to entry and exit dose as the tube is rotating and • the entrance dose is not much attenuated so the smaller obbject is homogenously and highly irradiated all over • Radiation dose to children is therefore a big issue
Options for reducing Dose Adjust mAto patient size and absorption Usually a maximum mA value is selected which is reduced whenever absorption is lower in a certain area or subject A 0° and a 90° scanogram is required. On these the mA value is calculated along the scanning length and the value of mA is changing during acquisition It is even possible to adjust mA in real time mode
Indirect effects on dose • Slice thickness • Thin sections reduce SNR. This is seen as wide standard deviation of HU numbers • Noise = 1/√T, T = slice thickness • Noise at 10-mm = noise at1-mm / 3.2 • This implies higher dose for satisfactory thin section SNR with increased mA or kV. • Reconstruction filters • High resolution filters iincrease noise and reduce SNR • This may mean increased dose for better SNR when such algorithms are used.
ReduceMilliamper-Seconds • Lowering mA by 50% reduces dose by 50% but increases noise by 41% (1/√ 2 = 1.41). • Depending on the clinical needs the above changes may be acceptable or not • i.e. • In the lung there is high inherent contrast between lung parenchyma and solid lesions and high noise is easily acceptable • In the liver there is low inherent contrast between parenchyma and lesions therefore a higher dose is necessary
Increase Pitch Dose reduction when all other parameters are kept stable BUT ………. it increases the effective section thickness which increase partial volume averaging and therefore reduces contrast between lesion and surrounding tissue.
Milliamper-Seconds and patient size Image quality increases with higher dose and the is no image deterioration by overexposure Doses to patients are high Several methods are in use which attempt to adjust dose to patient size and weight Exposure tables for CT are available as in plain radiography
kVp reduction • Dose reduction and noise increase • Also changes in contrast • CTDI100(and not CTDIw) shows that the dose gradient from the periphery to the center of the object is grater in lower kV • The dose to the skin is also higher at low kVp
Effective dose calculation effective dose= dose that takes into account the differences in sensitivity to radiation of the several body tissues It is calculated with several ways in phantoms
Noise lines • They are oriented along the maximum absorption of radiation because only a small number of photons reach the detector in this direction • They are lines either in the laterolateral or the anteroposterior direction (shoulders, pelvis) • When a stable mA is used patient taking into account the lateral absorption i.e. in the shoulders the chest will be irradiated more than necessary in the AP direction • The same holds true for changes in the Ζ-axis
European Journal of RadiologyVolume 76, Issue 1, October 2010 Noise lines in the shoulders (photon starvation artifact)
Automatic Exposure Control - AEC • AEC systems adjust mA depending on body thickness along the Z-axis and within a section in order to achieve satisfactory SNR with lower dose • There are 3 ways to apply AEC • Patient size • rotational • 3-D
Patient size - AEC • In CT patient is exposed in entry and exit radiation • AEC adjusts mAs taking into account the patient size and this is very efficient in children • Radiation dose to children is more important • The disadvantage the scan is performed with stable mAs regardless of the changes in patient size along the z-axis or within the section
Z-axis AEC • Beam attenuation changes along the patient • High in the shoulder area • Low in the chest • Hogh in the abdomen • This leads to different noise levels along the images when stable mAs is used. • Satisfactory noise level in the chest means higher noise in shoulders and abdomen, not acceptable. • Satisfactory noise level in the shoulders means higher dose in the chest • Z-axis AEC adjusts the current along the scan depending on the scanogram in order to achieve stable noise in all images. • Dose reduction up to 30%
Renal images • α) stablemAs • b) Z-axis AEC • Different examinations same patient. • Satisfactory images
RotationalAEC • mAs changes as the tube rotates around the patient. mAs increases automatically at the tube positions where beam attenuation is higher • Adjustment is calculated by • Measurements in the previous section • Measurements on the 2 scout views • Dose reduction 20-30%
Images of the pelvis (a) without and (b) with rotational AEC. Dose in β = 27% < α. Image satisfactory
3D-AEC • Combination of Z-axis and rotational AEC for even better results. • Available on all modern CT scanners.
Previous slide explanation • 3D-AEC in chest and • (a) coronal reconstruction from CT performed with stable mAs(green line) and resultant noise (red line) • (b) coronal reconstruction from CT with 3D-AEC • The thick green line sows the average mAs value in the Z-axis and the thin green line changes in mAs due to patient thickness in the axial plane • Image noise is relatively stable in all images along the Z-axis. • (c) radiation dose distribution shows overexposure of the lungs with stable mAs when compared with (d)3D-AEC
Dose reduction in cardiac CT • Is used in patients with average risk for coronary disease and in patients with acute onset chest pain. • Dose up to 20mSvwhen no reduction techniques are utilized (CT abdomen 14mSv, Lung CTA 15 mSv) • It requires thin sections 0.5–0.625 mm to show the thin coronary branches and low pitch • Fast tube rotation to achieve a “stationary heart”(0.3–0.4s) • Data are acquired during the whole cardiac cycle • only data from the diastole are used for Ct coronary angiography. • the complete set of data offer functional information • ejection fraction • movement of the heart wall.
Different ways of ECG gating • Retrospective gating • Continuous data collection • Reconstruction window is selected retrospectively at the middle of the diastolic phase of the ECG • Prospective gating with current modulation (PECMTC). • The mA is adjusted based on the ECG with a high value at the middle of the diastole and only at 30% during the remainder of the cardiac cycle. • Reconstruction window in the middle of diastole • Prospective gating (PEGAS). • Current is applied only during the middle of the diastole on ECG. • Depending on the heart rate the table moves either before the next R-wave on the ECG or with the next cardiac pulsation • “step and shoot”
Prospective electrocardiogram correlated modulation of tube current (PECMTC) • At the end of diastole the vessels are less affected by cardiac motion • By reducing current at the rest of the cardiac cycle the dose to the patient is reduced. • Current at 100% in middle diastole and at 30% in between • The data at reduced current are not sufficient for vessel study but they allow study of cardiac function. • More recently mA is reduced to 4% with a dose reduction by 25%