Download
1 / 36
360 likes | 373 Views
This training session covers the basics of water emissions, including the concepts, data options, and issues related to compiling water emissions accounts. Participants will learn about the importance of emissions to water and how they link to policy, as well as the steps involved in compiling a water emissions account.

E N D
Outline Outline 1. Learning objectives 2. Review of basics (5m) 3. Level 1 What? Why? (Compilers) • Concepts (15m) • Group exercise & Discussion (30m) 4. Level 2 (Data providers) • Data options, examples & issues (15m) • Group exercise & Discussion (15m) 5. Closing Discussion (10m) Manila SEEA-CF - Water emission accounts
Learning Objectives Learning objectives: Levels 1 and 2 • Level 1: • Understand why Emissions to Water are important and how they link to policy • Understand the basic concepts of Accounting for Emissions to Water • Understand how water is treated in the SEEA • Learn the steps of compiling a Water Emissions Account • Level 2: • Understand the data options and sources • Understand the important conceptual issues • Be aware of how other countries have approached Water Emissions Accounting SEEA-CF - Water emission accounts
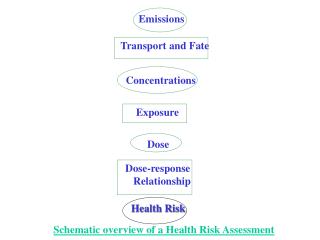
2. Review of basics Are we polluting our water assets? Renewable supply The economy Abstraction & Use Water Assets Emissions Returns Water account - SEEA CF
2. Review of basics Water emissions accounting • What? • Effluent: quantity of wastewater in m3 (regardless of quality) • Emission: quantity of substance in the effluent (in tonnes) • Why? • Policies on water quality & security, resources management • Links to economic accounts (EPE, intensities) • Basis for SEEA-WATER, SEEA-EEA (ecosystems), FDES 3.2 • Indicators: • Total water emissions supply (who makes it?) • Total water emissions (who treats it?) • Water emissions intensity/productivity (who makes the most?) • Treatment capacity (is there enough?) SEEA-CF - Water emission accounts
2. Review of basics Waste water in the news SEEA-CF - Water emission accounts
2. Review of basics What is the problem? • We put things into the water stream: • Pathogens, poisons, metals: Make us & ecosystems sick • Organic materials: Cause eutrophication (too little oxygen) • Heat: Changes in ecosystems • Emerging issue: microbeads, microplastics (effect not certain) • Untreated wastewater returns to • Water supply (need to treat it again) • Environment (soil, runoff to rivers, groundwater, ocean) • Emissions to water is • a waste that can be captured & reused SEEA-CF - Water emission accounts
3. Level 1 Water Emissions Account • Learning objectives • Review of Level 0 (5m) • Level 1 (Compilers) • Concepts (15m) • Group exercise & Discussion (30m) • Level 2 (Data providers) • Data options, examples & issues (15m) • Group exercise & Discussion (15m) • Closing Discussion (10m) SEEA-CF - Water emission accounts
3. Level 1 In simple terms… • Generation • What, how much and by whom? • Collection, treatment and reuse • Waste Water Treatment Plants (WWTP) • Reuse of water (usually cleaner) • Reuse pollutants removed • Discharge to environment Releases in wastewater 106 Pollutants removed by WWTPs 6 Pollutants in water for reuse 4 Waterborne emissions to the environment 34 Source: UNSD 2014 SEEA-CF - Water emission accounts
3. Level 1 Water emissions in the water cycle Water emissions flows Source: WWAP SEEA-CF - Water emission accounts
3. Level 1 What does a Water Emissions Account look like? Start with gross volumes of water released (m3): • To establish flows to environment or to treatment • SEEA Water Supply/Use provides estimates of volumes of water treated and discharged Include… Select relevant substances (tonnes) • Point sources: sewerage facilities, power plants, industry • Non-point sources: urban runoff, agriculture • BOD (organic substances) • COD (inorganic substances) • Suspended solids • Phosphorous (nutrient) • Nitrogen (nutrient) Estimate quantities of substances • From concentrations • From “factors” (e.g., per household per day, per m3 effluent) • Solid wastes dumped into water are in Solid Waste Account • Supply • Gross releases of substances (tonnes): • Release to other economic units For each, account for… • Use • Emissions received by the environment • Collection by other economic units SEEA-CF - Water accounts
3. Level 1 Flows in water emissions accounts Industry (e.g., mining, manufacturing) Households Sewage industry Environment (e.g., surface water, oceans and seas) SEEA-CF - Water emission accounts
3. Level 1 The supply-use chain (kind of) Release after treatment Direct releases To sewage SEEA-CF - Water emission accounts
3. Level 1 What does a water emissions Account look like? Physical supply • Emissions are direct discharge to the environment • Releases to other economic units are amounts sent for treatment How much BOD/COD do households generate? What % is untreated? 2,712 + 8,950 = 11,662 2,712/11,662 = 23% What industry is generating all this? Agriculture SEEA-CF - Water emission accounts
3. Level 1 What does a water emissions Account look like? Physical use • Emissions received are total discharge to the environment • Collection by other economic units are amounts sent for treatment If the sewerage industry Collects 16,877T BOD/COD, Emits 5,994T (previous slide) Where does the rest (10,893T) go? Solid waste or sludge pond SEEA-CF - Water emission accounts
3. Level 1 Examples of Water emissions-related SDG indicators • 6.2.1 Proportion of population using safely managed sanitation services • 6.3.1: Percentage of wastewater safely treated • 6.3.2 Proportion of water bodies with good ambient quality • 6.4.2 Level of water stress: freshwater withdrawal as a proportion of available freshwater resources SEEA-CF - Water emission accounts
3. Level 1 Compilation Group Exercise (30m) • Situation: • Have some source factors and gross discharge amounts • Objective (Groups of 3-5): • Compile a Water Emissions Account • Report results SEEA-CF - Water emission accounts
3. Level 1 The situation • The country has a population of 50 million • 85% are connected to the sewer network • A survey estimates that each person generates: • 60g of BOD/day • 130g of COD/day • 70g of Suspended Solids/day • Per year, agriculture applies 5MT of phosphorous and 10MT of nitrogen. All is emitted to the environment. • Industry discharges 5Mm3 of water per year. Tests show that, after own treatment, the average concentration of: • Heavy metals is 3.2g/m3 • COD is 2.5kg/m3 • The sewage industry is 80% efficient in removing BOD, COD and Suspended Solids • Compile the water emissions supply and use tables below. What are the totals discharged to the environment? SEEA-CF - Water emission accounts
3. Level 1 The answers Water Emissions Account • Per day, 50 million people generate • 60g BOD • 130g COD • 70G TSS • 85% is treated • 50,000,000 * .06 * 365/1000 *.85 • 15% is released to the environment • 50,000,000 * .06 * 365/1000 *.15 SEEA-CF - Water emission accounts
3. Level 1 The answers Water Emissions Account • Agriculture applies 5MT Phosphorous and 10MT Nitrogen • Industry discharges 5Mm3 wastewater • COD is 2.5kg/m3 • 5,000,000 * 2.5/1000 • Heavy metals are 3.2g/m3 • 5,000,000 * .0032/1000 • Totals emitted to environment SEEA-CF - Water emission accounts
4. Level 2 Water Account • Learning objectives • Review of Level 0 (5m) • Level 1 (Compilers) • Concepts (15m) • Group exercise & Discussion (30m) • Level 2 (Data providers) • Data options, examples & issues (15m) • Group exercise & Discussion (15m) • Closing Discussion (10m) SEEA-CF - Water emission accounts
4. Level 2 Types of water emissions and sources *You can find main sources of the pollutants in Annex SEEA-CF - Water emission accounts
4. Level 2 Good news! You don’t need to measure (much) • Data: • Household emissions estimated from factors • e.g., One household discharges 60g/day BOD • Agriculture discharges all pesticides and fertilizers applied • Industries are often regulated to limit emissions (standard) • e.g., Plant xxx averages 100m3 effluent per day, BOD is 2.5kg/m3 • Industries may need to report on quantities released • e.g., via Pollutant Release and Transfer Registry (PRTR) • Expertise: • Statisticians • Industrial engineers (to estimate discharge) • Water supply and treatment specialists SEEA-CF - Water emission accounts
4. Level 2 Common problems in compilation Scope • Sewage treatment only covers amounts collected • (not generated) Data Quality • Getting data from industries and farms with own treatment • Local emission factors • (urban/rural, high/low income, industry by type…) Scale of data • National level data may hide regional variation Administrative data • Expenditures on fuel (by type), consumption of fuel • Energy utilities • Annual averages may hide seasonal variation and extremes • (e.g., seasonal operators, rainy/dry seasons) Seasonality SEEA-CF - Water accounts
4. Level 2 Data options • Global data sources • Agricultural fertilizers and pesticides: FAOStat (http://www.fao.org/faostat/en/#data) • Wastewater (produced, collected, treated, capacity, untreated, use: FAO AquaStat (http://www.fao.org/nr/water/aquastat/data/query/index.html?lang=en) • Very few data points for the Philippines SEEA-CF - Water emission accounts
4. Level 2 PRTR: Pollutant Release and Transfer Registers • If your country have PRTR, USE IT!! • OECD: International guidelines & data clearinghouse • Usually large emitters of large quantities • Canada: National Pollutant Release Inventory (NPRI) • Collected via mandatory questionnaire • Only specific substances • Publicly accessible maps, data • But…some substances, small emitters, mobile sources not covered Source: https://www.ec.gc.ca/inrp-npri/ SEEA-CF - Air emissions accounts
4. Level 2 Some Country examples • Canada: • Using 3 different sources… • No compilation of water emission accounts (report wastewater) • Volumes treated, quality of intake, outflow, costs Drinking Water Plants Survey (DKWP) • Mandatory reporting of large amounts by large companies (by location) National Pollutant Release Inventory (NPRI) Survey of Industrial Processes (SIP) (pilot) • Processes in place to limit pollutants (adjunct to NPRI) SEEA-CF - Water emission accounts
4. Level 2 France 1990s Basic statistics, but beginnings of an account • In preparation of the 1992 water law • Shows the point polluting emissions discharged through sewerage Industries connected to sewers Households OM=1.105 TSS=1.745 Pollution eliminated OM=0.364 TSS=1.745 OM=0.609 TSS=1.897 Sewers OM=0.885 TSS=1.139 OM=0.583 TSS=0.885 WWTP OM=0.276 TSS=0.241 OM=Organic Matter TSS=Total suspended solids. WWTP=Wastewater Treatment Plants Natural water bodies Examples of pollution flows in France (million tons per year) Ministry of Environment of France, 1990s SEEA-CF - Water emission accounts
4. Level 2 Other countries? • Netherlands: Nutrients and heavy metals; based on reported emissions (kg); net approach Measure for the environmental efficiency of production processes = The most intense polluter Source: Environment Accounts of the Netherlands 2013 SEEA-CF - Water emission accounts
4. Level 2 Other countries • Denmark: Wastewater and monetary accounts • Others? • Water emissions is not in EU list • European environmental accounts: established in Regulation (EU) 691/2011 • The regulation includes… • Air emissions accounts (AEA) • Economy-wide material flow accounts (EW-MFA) • Physical energy flow accounts (PEFA) • Environmental taxes • Environmental goods and services sector (EGSS) accounts • Environmental protection expenditure accounts (EPEA) • Other European environmental accounts… • Forest accounts • Environmental subsidies and similar transfers accounts SEEA-CF - Water emission accounts
Take home points Take home points • Water Emission Accounts track quantities of pollutants in wastewater • Monitor policies to reduce pollution; reduce water waste • Link to • SEEA Water PSUT: Volume of water treated & released • SEEA Solid Waste: Disposition of collected emissions • SEEA EPE: Expenditures on wastewater management • Links to FDES 3.3.2: Generation and management of wastewater • Data sources include emission factors, release reports, effluent quality monitoring • Main challenges: local factors, data from many sources SEEA-CF - Water emission accounts
Discussion Discussion • What are the priorities? • Which pollutants: BOD, COD, metals, nutrients, pharma? • Which stage: generation, municipal treatment, release to environment, water reclamation? • What data are available? • Who else should be consulted? • For tomorrow: • Look for national data for generation, treatment and release of emissions to water (nothing in CPES 2014?) • Household, industrial factors SEEA-CF - Water emission accounts
References References • OECD PRTR (Pollutant release and transfer registry): http://www.oecd.org/chemicalsafety/pollutant-release-transfer-register/ • Peal, A., Blackett, I., Hawkins, P. M. and Heymans, C. 2014. Fecal sludge management: A comparative analysis of 12 cities. Journal of Water Sanitation and Hygiene for Development, Vol. 4, No. 4, pp. 563–575. doi:10.2166/washdev.2014.026 • Sato, T., Qadir, M., Yamamoto, S., Endo, T. and Zahoor, A. 2013. Global, regional, and country level need for data on wastewater generation, treatment, and use. Agricultural Water Management, Vol. 130, pp. 1–13. dx.doi.org/10.1016/j.agwat.2013.08.007 • SEEA-Central Framework: http://unstats.un.org/unsd/envaccounting/seeaRev/SEEA_CF_Final_en.pdf • SEEA-Agriculture, Forestry and Fisheries: http://unstats.un.org/unsd/envaccounting/aff/2GC_Draft.pdf • UNSD. 2014. Guidelines for the Compilation of Water Accounts and Statistics (Draft). https://seea.un.org/content/water • WWAP (United Nations World Water Assessment Programme). 2017. The United Nations World Water Development Report 2017. Wastewater: The Untapped Resource. Paris, UNESCO. http://www.unesco.org/new/en/natural-sciences/environment/water/wwap/wwdr/2017-wastewater-the-untapped-resource/ SEEA-CF - Water emission accounts
Acknowledgement Acknowledgement • Materials prepared by: • Michael Bordt • Regional Advisor on Environment Statistics ESCAP Statistics Divisionbordt@un.org • More self-learning resources on: http:/communities.unescap.org/environment-statistics • Hye Kyeong Choi • Consultant on Environment Statistics ESCAP Statistics Divisiongracechoi0102@gmail.com • Materials adapted from: • Original work from SEEA-CF manual • seea@un.org SEEA-CF - Water emission accounts
Annex Types of water emissions and sources (1) SEEA-CF - Water emission accounts
Annex Types of water emissions and sources (2) SEEA-CF - Water emission accounts