Download
1 / 63
630 likes | 649 Views
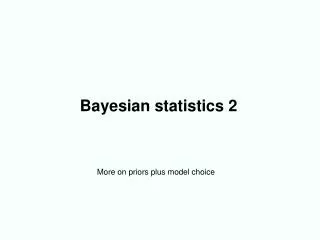
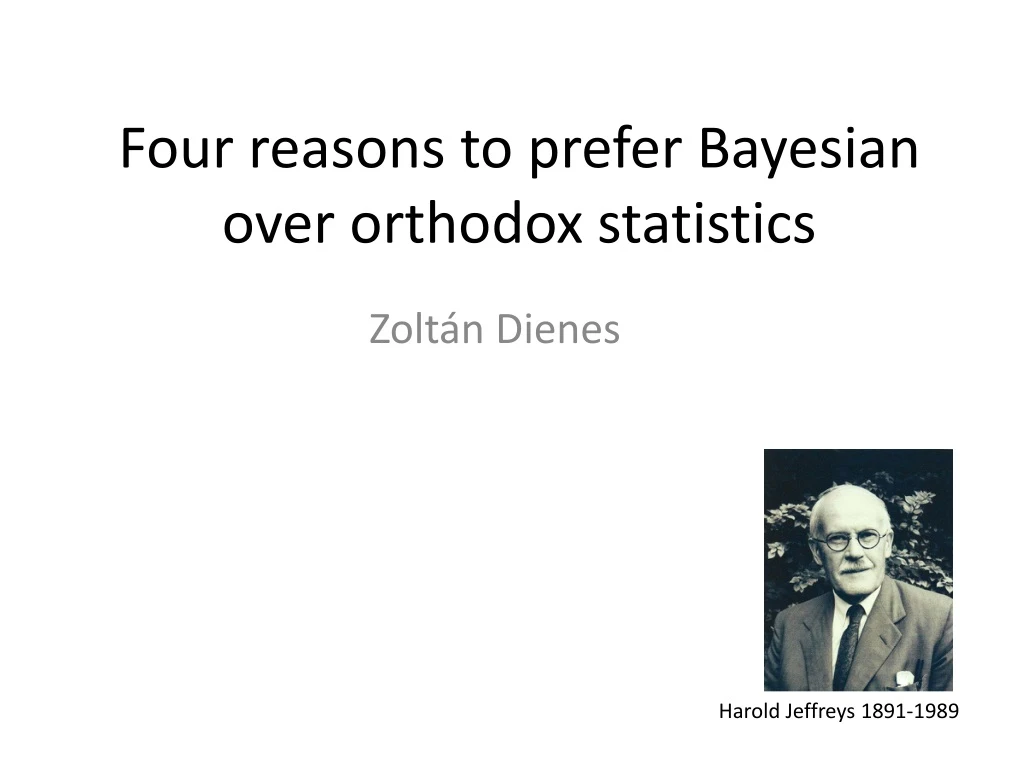
Four reasons to prefer Bayesian over orthodox statistics. Zoltán Dienes. Harold Jeffreys 1891-1989. No evidence to speak of. E vidence for H1. E vidence for H0. P-values make a two-way distinction:. No evidence to speak of. E vidence for H1. E vidence for H0.

E N D
Four reasons to prefer Bayesian over orthodox statistics Zoltán Dienes Harold Jeffreys 1891-1989
No evidence to speak of Evidence for H1 Evidence for H0
P-values make a two-way distinction: No evidence to speak of Evidence for H1 Evidence for H0
P-values make a two distinction: No evidence to speak of Evidence for H1 Evidence for H0 NO MATTER WHAT THE P-VALUE, NO DISTINCTION MADE WITHIN THIS BOX
No inferential conclusion follows from a non-significant result in itself But it is now easy to use Bayes and distinguish: Evidence for null hypothesis vs insensitive data
The Bayes Factor:Strength of evidence for one theory versus another (e.g. H1 versus H0):The data are B times more likely on H1 than H0
From the axioms of probability: P(H1 | D) = P(D | H1) * P(H1) P(H0 | D) P(D | H0) P(H0) Posterior confidence = Bayes factor * prior confidence in H1 rather than H0 Defining strength of evidence by the amount one’s belief ought to change, Bayes factor is a measure of strength of evidence
If B = about 1, experiment was not sensitive. If B > 1 then the data supported your theory over the null If B < 1, then the data supported the null over your theory Jeffreys, 1939: Bayes factors more than 3 are worth taking note of B > 3 noticeable support for theory B < 1/3 noticeable support for null
Bayes factors make the three way distinction: 3 … 1/3 … 3 0 … 1/3 No evidence to speak of Evidence for H1 Evidence for H0
The symmetry of B (and not p) means: Can get evidence for H0 just as much for H1 - help against publication bias - people claim they have evidence against H1 only if they have such evidence Can run until evidence is strong enough (Optional stopping no longer a QRP) Less pressure to B-hack – and when it occurs can go in either direction.
A model of H0 A model of the data
A model of H0 A model of the data A model of H1
How do we model the predictions of H1? How to derive predictions from a theory? Theory Predictions
How do we model the predictions of H1? How to derive predictions from a theory? Theory assumptions Predictions
How do we model the predictions of H1? How to derive predictions from a theory? Theory assumptions Predictions Want assumptions that are a) informed; and b) simple
How do we model the predictions of H1? How to derive predictions from a theory? Theory assumptions Plausibility Model of predictions Magnitude of effect Want assumptions that are a) informed; and b) simple
Example Initial study: flashing the word “steep” makes people walk 5 seconds more slowly done a fixed length of corridor (20 versus 25 seconds). Follow up Study: flashes the word “elderly.” What size effect could be expected?
Some points to consider: • Reproducibility project (osf, 2015): Published studies tend to have larger effect sizes than unbiased direct replications; • Many studies publicise effect sizes of around a Cohen’s d of 0.5 (Kühberger et al 2014); • but getting effect sizes above a d of 1 very difficult (Simmons et al, 2013). Original effect size Replication effect size Behavioural economics Psychology
Assume a measured effect size is roughly right scale of effect • Assume rough maximum is about twice that size • Assume smaller effects more likely than bigger ones • => • Rule of thumb: • If initial raw effect is E, then assume half-normal with SD = E Plausibility Possible population mean differences
Shih, Pittinsky, and Ambady (1999) American Asian women primed with an Asian identity will perform better on a maths test than those primed with a female identity. M = 11%,t(29) = 2.02, p = .053
Shih, Pittinsky, and Ambady (1999) American Asian women primed with an Asian identity will perform better on a maths test than those primed with a female identity. M = 11%,t(29) = 2.02, p = .053 Gibson, Losee, and Vitiello (2014) M = 12%, t(81) = 2.40, p = .02.
Shih, Pittinsky, and Ambady (1999) American Asian women primed with an Asian identity will perform better on a maths test than those primed with a female identity. M = 11%,t(29) = 2.02, p = .053 Gibson, Losee, and Vitiello (2014) M = 12%, t(81) = 2.40, p = .02. BH(0, 11) = 4.50.
Williams and Bargh (2008; study 2) asked 53 people to feel a hot or a cold therapeutic pack and then choose between a treat for themselves or for a friend. selfish treat prosocial Cold 75% 25% Warmth 46% 54% Ln OR = 1.26
Williams and Bargh (2008; study 2) asked 53 people to feel a hot or a cold therapeutic pack and then choose between a treat for themselves or for a friend. selfish treat prosocial Cold 75% 25% Warmth 46% 54% Ln OR = 1.26 Lynott, Corker, Wortman, Connell et al (2014) N = 861 people ln OR = -0.26, p = .062
Williams and Bargh (2008; study 2) asked 53 people to feel a hot or a cold therapeutic pack and then choose between a treat for themselves or for a friend. selfish treat prosocial Cold 75% 25% Warmth 46% 54% Ln OR = 1.26 Lynott, Corker, Wortman, Connell et al (2014) N = 861 people ln OR = -0.26, p = .062 BH(0, 1.26) = 0.04
1. A high powered non-significant result is not necessarily evidence for H0
Banerjee, Chatterjee, & Sinha, 2012, Study 2 recall unethical deeds 74 ethical deeds 88 Mean difference = 13.30, t(72)=2.70, p = .01, 0 effect size for H0 13.30 Estimated effect size for H1 Brandt et al (2012, lab replication): N = 121, Power > 0.9
Banerjee, Chatterjee, & Sinha, 2012, Study 2 recall unethical deeds 74 ethical deeds 88 Mean difference = 13.30, t(72)=2.70, p = .01, 0 effect size for H0 13.30 Estimated effect size for H1 Brandt et al (2014, lab replication): N = 121, Power > 0.9 t(119)=0.17, p = 0.87
Banerjee, Chatterjee, & Sinha, 2012, Study 2 recall unethical deeds 74 ethical deeds 88 Mean difference = 13.30, t(72)=2.70, p = .01, 0 effect size for H0 5.47 Sample mean 13.30 Estimated effect size for H1 Brandt et al (2014, lab replication): N = 121, Power > 0.9 t(119)=0.17, p = 0.87
Banerjee, Chatterjee, & Sinha, 2012, Study 2 recall unethical deeds 74 ethical deeds 88 Mean difference = 13.30, t(72)=2.70, p = .01, 0 effect size for H0 5.47 Sample mean 13.30 Estimated effect size for H1 Brandt et al (2014, lab replication): N = 121, Power > 0.9 t(119)=0.17, p = 0.87, BH(0, 13.3) = 0.97
A high powered non-significant result is not in itself evidence for the null hypothesis To know how much evidence you have for a point null hypothesis you must use a Bayes factor
2. A low-powered non-significant result is not necessarily insensitive
Shih, Pittinsky, and Ambady (1999) American Asian women primed with an Asian identity will perform better on a maths test than unprimedwomen Mean diff = 5%
Shih, Pittinsky, and Ambady (1999) American Asian women primed with an Asian identity will perform better on a maths test than unprimedwomen Mean diff = 5% Moon and Roeder (2014) ≈50 subjects in each group; power = 24% M = - 4% t(99) = 1.15, p = 0.25.
Shih, Pittinsky, and Ambady (1999) American Asian women primed with an Asian identity will perform better on a maths test than unprimedwomen Mean diff = 5% Moon and Roeder (2014) ≈50 subjects in each group; power = 24% M = - 4% t(99) = 1.15, p = 0.25. BH(0, 5) = 0.31
Shih, Pittinsky, and Ambady (1999) American Asian women primed with an Asian identity will perform better on a maths test than unprimedwomen Mean diff = 5% Moon and Roeder (2014) ≈50 subjects in each group; power = 24% M = - 4% t(99) = 1.15, p = 0.25. BH(0, 5) = 0.31 NB: A mean difference in the wrong direction does not necessarily count against a theory If SE twice as large then t(99) = 0.58, p = .57 BH(0, 5) = 0.63
The strength of evidence should depend on whether the difference goes in the predicted direction or not YET A difference in the wrong direction cannot automatically count as strong evidence
3. A high-powered significant result is not necessarily evidence for a theory
Outcomes allowed by theory 1 Outcomes allowed by theory 2 All conceivable outcomes
Outcomes allowed by theory 1 Outcomes allowed by theory 2 It should be harder to obtain evidence for a vague theory than a precise theory, even when predictions are confirmed. A theory should be punished for being vague All conceivable outcomes
Outcomes allowed by theory 1 Outcomes allowed by theory 2 It should be harder to obtain evidence for a vague theory than a precise theory, even when predictions are confirmed. A theory should be punished for being vague. A just significant result cannot provide a constant amount of evidence for an H1 over H0; the relative strength of evidence must depend on the H1 All conceivable outcomes
Williams and Bargh (2008; study 2) asked 53 people to feel a hot or a cold therapeutic pack and then choose between a treat for themselves or for a friend. selfish treat prosocial Cold 75% 25% Warmth 46% 54% Ln OR = 1.26 Lynott, Corker, Wortman, Connell et al (2014) N = 861 people ln OR = -0.26, p = .062
Williams and Bargh (2008; study 2) asked 53 people to feel a hot or a cold therapeutic pack and then choose between a treat for themselves or for a friend. selfish treat prosocial Cold 75% 25% Warmth 46% 54% Ln OR = 1.26 Lynott, Corker, Wortman, Connell et al (2014) N = 861 people ln OR = -0.26, p = .062 Counterfactually, Ln OR = + 0.28, p < .05 selfish treat prosocial Cold 53.5%46.5% Warmth 46.5%53.5%
Williams and Bargh (2008; study 2) N = 53 Ln OR = 1.26 Replication N = 861 Ln OR = + 0.28, p < .05 0 effect size for H0 1.26 Estimated effect size for H1
Williams and Bargh (2008; study 2) N = 53 Ln OR = 1.26 Replication N = 861 Ln OR = + 0.28, p < .05 0 effect size for H0 1.26 Estimated effect size for H1
Williams and Bargh (2008; study 2) N = 53 Ln OR = 1.26 Replication N = 861 Ln OR = + 0.28, p < .05 BH(0, 1.26) = 1.56 0 effect size for H0 1.26 Estimated effect size for H1