Download
1 / 23
230 likes | 414 Views
Compton-thick AGN in the CDFN. I. Georgantopoulos NOA A. Akylas NOA A. Georgakakis NOA M. Rovilos MPE M. Rowan-Robinson Imperial College. Why are Compton thick AGN important ?.

E N D
Compton-thick AGN in the CDFN I. Georgantopoulos NOA A. Akylas NOA A. Georgakakis NOA M. Rovilos MPE M. Rowan-Robinson Imperial College
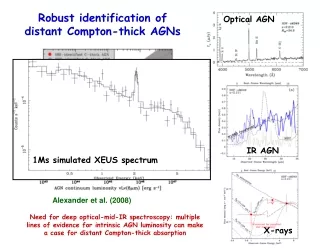
Why are Compton thick AGN important ? • X-ray surveys are extremely efficient in detecting AGN: the sky density of AGN is 5000 deg-2 (Bauer+04) orders of magnitude higher than that in the optical (eg Wolf+ 03) • However, at very high obscurations (NH~1024 cm-2 or AV>>100) even the hard 2-10 keV X-rays cannot penetrate these columns (Compton-thick AGN). • C-T are extremely important for the peak of the X-ray background at 40 keV (Gilli et al. 2007) • Spitzer mid-IR surveys are claiming the detection of AGN which are not detected in X-ray • The French/Italian Simbol-X, Japanese NeXT have as their main science goals the detection of these sources at very high energies.
Plot adapted from Gilli et al. Simbol-X Present sample
Talk Outline • A) X-ray spectral analysis in the CDF-N • B) X-ray Stacking analysis of mid-IR selected AGN not detected individually in the X-ray
The sample • Selected all CDFN sources in the 2-10 keV band with flux > 1.e-15 cgs ie an order of mag above the flux limit • Two reasons: i) very good photon statistics spectra ii) Large number of redshifts (spec and photo) 222 sources of which 190 have redshift (107 spect) The photo-z have been derived using the code of Babbedge et al. using the IRAC Mags where available. Median number of photons ~200
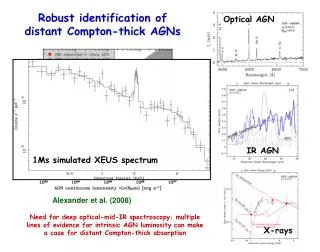
Method • C-T AGN can be detected either: a) Absorption turn-over below 10 keV which shifts at lower energies at high redshifts because of K-correction b) a flat spectrum Γ~1 (eg Matt 1996)
Spectral fits • a) single power-law model (WA*PO) with the NH free and Γ=1.8 b) single power-law model with the photon index free and the NH fixed to the Galactic. Then one can compare the values of chi-2 for the two models We require Γ<1.2 (at the 90% upper limit) and Δχ2 > 5 corresponding to a probability value of about 2σ that the ABSORBED model is better than the FLAT one [Likelihood ratio test Mushotzky 1982]
9 Compton thick sources 8 flat spectrum C-T candidates PLUS 1 for which we can see the spectral turnover directly at z=2 1 has no redshift (not in GOODS), 6/8 spectroscopic Redshifts Mean redshift z=2.0 logLx=42-43 (observed) Four of them are sub-mm sources (Alexander+2006)
The C-T logN-logS Our points Gilli predictions
The Stern diagram: non X-ray detections Is there a population of mid-IR AGN not detected in X-ray ? Georgantopoulos+08 astro-ph/ AGN GOODS IRAC sources
X-ray stacking analysis • One can increase the effective exposure time by adding (stacking) the photons in areas of non-detected sources. • 126 mid-IR ‘AGN’ at mean redshift z=1.4 • Detection in both the soft (0.3-1.5 keV) and hard (1.5-4 keV) band but with a soft spectrum Γ~2.1 Moreover, - Lx/LIR ~ 10-5 - Lx ~ 6x1040 cgs (soft band) further supporting the galaxy scenario.
Optically-faint & red sources (a la Fiore selection) • Criteria: R-[3.6] > 3.7 RED (EROs) 24 μm/R > 1000 optically FAINT 103 sources of which 20 detected in X-rays The stacking analysis of the 83 gives Γ~0.8 or NH= 8x1022 cm-2 (@z=2) Lx/LIR ~ 10-5 These are either C-T or low luminosity absorbed AGN
Optically faint/ red sources: mid-IR diagram • Many sources outside the Stern wedge where the galaxy and Sy2 templates converge at z>2 X = x-ray detection • = non-detection
ACS z-band cutouts of the X-ray detections in the selection ‘a la Fiore Green circle = 3.6 micron position
X-ray Absorbed sources are associated with early-type systems at z~1. Does the same hold at higher redshifts ? • X-ray obscured sources are RED at z~1 • Rovilos & Georgantopoulos 07 (ECDFS) • Georgakakis+08 (AEGIS) • See also Silverman+07 • is there another tendency at higher z ?
Remarks • Compton-thick candidate AGN can be easily detected through X-ray spectroscopy. XMM observations could then play the major role • Advertisement of the 1.3 CDFS XMM observation (PI Comastri) of the CDFS which will provide many bona-fide C-T AGN at faint fluxes • At brighter fluxes the fraction of C-T AGN is >>1/100. Analysis of the whole 2XMM catalogue should produce at least a few tens • In the future all the pieces of the puzzle will be filled at faint 2-10 keV fluxes with XEUS and observations at hard energies with Simbol-X and NEXT
Stern diagram : X-ray detections Stern+05 wedge is a good way to sift mid-IR AGN But not all X-ray AGN fall into the Stern wedge see also Barmby+06