Download
1 / 52
520 likes | 655 Views
Indoor Environments. John D. Spengler, Ph.D. Akira Yamaguchi Professor of Health & Human Habitation Harvard School of Public Health. E-119 November 9, 2010. Indoor Environmental Quality in Buildings. Commercial Building Energy Use. LIGHTING 27% Space Heating 15% Space Cooling 14%.

E N D
Indoor Environments John D. Spengler, Ph.D. Akira Yamaguchi Professor of Health & Human Habitation Harvard School of Public Health E-119 November 9, 2010
Commercial Building Energy Use LIGHTING 27% Space Heating 15% Space Cooling 14% Energy Future. American Physical Society (2008)
Sick Building Syndrome (WHO, 1983) Diagnosis of SBS requires demonstration of an elevated complaint or symptom prevalence that is associated with a particular building, and that symptom patterns do not match other clinically recognized syndromes.
Sick Building Syndrome Symptoms linked to building Resolve when not in building Effect a substantial fraction of occupants Terminology
Dry, itchy eyes Nasal irritation Hoarseness, irritated throat, laryngitis Skin problems Fuzzy thinking, memory Irritability, sleep disruption, fatigue Headaches, nausea Sick Building Symptoms
Contagious Diseases Influenza SARS Common cold (HRV) Measles Chicken pox TB Environmental Legionnaires Humidifier fever Asthma CO poisoning Nitrogen Dioxide Pesticide poisoning Lung Cancer Radon, asbestos, ETS Potential Building Related Illnesses
Odors, drafts, temperature, humidity Water intrusion Dust, particles Vibrations, visual changes, new equipment, alterations, maintenance Management stresses, labor issues, personal agendas Rumors Triggers of IAQ Concerns
Sustainability Guidelines Partially Address Health • Low VOC’s • Ventilation • Commissioning • CO2 monitoring • LEED and BREEM have IEQ credits
IAQ and Building Costs • Labor $200 / square foot • Financing $ 20 / square foot • Energy $ 2 / square foot • Cleaning $ 1 / square foot
How Sustainable Buildings Could Improve Health & Productivity Thermal state Hearing & concentration Vision Attitude Mental performance Sustainable Buildings Better design, construction, commissioning & O&M Superior Work Performance Economic Benefits Improved Indoor Environmental Quality Less Absence Reduced Health Care Costs Better Health W. Fisk, LBNL, White House Conference, Jan. 2006
Air Handling & Conditioning Source: EPA
= Reference Group = Significantly more symptoms = Same # Air Conditioning (AC) Link to Increased SBS Symptoms in Offices Type of ventilation system Source: Seppanen and Fisk, Indoor Air Journal 2002
Cleanliness of air handling systems – potential explanation • The air handling system is a source of sensory air pollution in buildings • Every component seems to generate pollution (European Airless Project 2001) • filters, coils, ducts
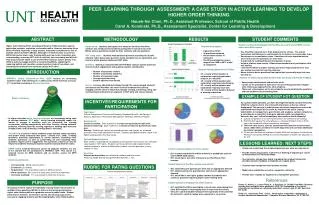
62 office printers were investigated for ultra-fine particle Emissions in typical open office space. 4 classes: none emitters, low emitters, medium and high Emitters 60% no or low emitters 13% medium emitters 27% high emitters
P/cc 100,000 10,000 1,000 100
Ventilation Fresh Outside Air – delivered indoors • cfm / person cubic feet per minute per person – or – • l / s – p liters per second per person
Ventilation Requirements • 1.5 cfm / person – O2 demand • 2.5 cfm / person – CO2 dilution • 5 cfm / person – old energy standard • 10 cfm / person – people without sources
Minimum Ventilation Rates Source: EPA
ASRAE 62 Standards • 62-73 was 5cfm/p • 62-81 5cfm/p but 15cfm/p with smoking • 62-89 15cfm/p assumed smoking • 62-97 15cfm/p excluded smoking • 62-2003 separate residential stnd.
Ventilation Guidelines • Minimum • 15 cfm / person • Office • 20 cfm / person • Smoking • 60 cfm / person
The Evidence for Ventilation: • Major Points • Higher ventilation rate (higher rate of outdoor air supply) is associated with objectively measured improvements in work performance • Higher ventilation rate is associated with reduced respiratory illness, less absence, and reduced sick building symptoms W Fisk, LBNL
Classroom code minimum Current minimum for offices in most codes L/s-p 21 42 66 85 106 cfm/p 0 Performance relative to performance with 6.5 L/s-person (13 cfm/person) Seppanen, Fisk, Lei-Gomez (Indoor Air Journal 2005)
An example of data on ventilation and short term sick leave (Milton et al. 2000) Short term sick leave 1.96 % 1.6 days per year 40 buildings in study 1.16 % 24 L/s per person 12 L/s 24 cfm 48 cfm per person
The Evidence for Temperature: • Major Point • High and low temperature is associated with objectively measured decrements in work performance
Relative Work Performance vs. Temperature (maximum performance at at 21.8 oC, 72 oF ) Source: Statistical analysis of research data from 24 studies relating temperature with objectively measured work performance outcomes Seppanen and Fisk (2005)