Download
1 / 29
290 likes | 406 Views
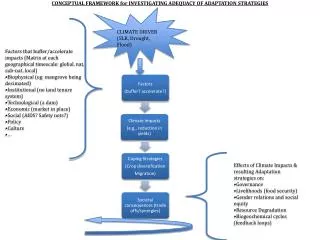
Context: In Jan 2011 FEWS NET issued an accurate projection of food insecurity if the long rains failed, how predictable might the long rains be?. This study analyzes January and MAM climate fields for 8 recent drought years. Outlier.

E N D
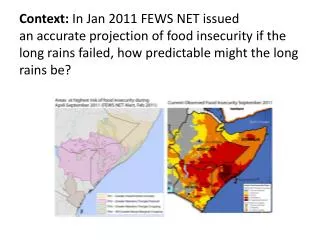
Context: In Jan 2011 FEWS NET issuedan accurate projection of food insecurity if the long rains failed, how predictable might the long rains be?
This study analyzes January and MAM climate fields for 8 recent drought years Outlier MAM SPI time-series for high-risk region in southern Ethiopia, central-eastern Kenya and Southern Somalia. Boxes show drought years (those with SPI <-0.5). While 1992 was an outlier, all the other years exhibited similar SST gradients, and large scale atmospheric responses. Data: GPCP topped with RFE2 for 2011
MERRA MAM SST Z-scores Brown = Hot Blue =Cold While the positions vary, in all dry seasons, an SST gradient existed across the western-central Pacific. The role of the Indian Ocean is less clear. MAM climate seems similar to January climate in the Pacific, supporting prediction.
1984 Wet Wet Warm
2000 Wet Wet Warm
2004 Warm Wet Wet 2004 seems more influenced by Indian Ocean Dipole
2007 Wet Wet Warm
2008 Wet Wet Warm
2009 Wet Wet Warm
2011 Warm Wet Wet
Wet, Dry and Normal Year SST transects Key Points : 1) Note that SST relationship across the Pac is uncorrelated, wet and dry years cool! 2) Nonetheless, 7 of 8 dry years have SST gradient 3) Even with low grid cell correlations, the GFS might capture the impact of the SST gradients
Coherent patterns (Excluding 1992) • Western and Central Pacific SST gradients appear to be the key forcing element • SST z-scores exhibit a steep down-up-down pattern, with a maxima between 140°E and 160°E • These gradients represent substantial zonal available potential energy • All years exhibited a rainfall gradient maxima to the west of the SST gradient maxima (between 80 and 120E) • All years exhibited large easterly moisture transport anomalies across the eastern Pacific, and some westerly transport anomalies into the western Pacific • The large scale climate anomalies are large (quasi-global?), and likely to be persistent, and predictive • The SST-gradient driven anomalous circulation patterns are likely to be predicted well using climate models driven with SSTs. • Statistical modeling seems difficult, given the spatial non-stationarity • Coupled models seem to have weak Western Pacific rainfall responses, and hence may not be the best predictive tool
MERRA MAM Precip Brown = Dry Blue = Wet
January GPCP/TRMM Anomalies Heavy convection
Modeling Experiment • Multi-model ensemble mean (72 members) MAM RR anomaly (mm/day) from simulations using observed SSTs, averaged over1999-2009. • Ensemble mean (24 members) ECHAM5 precipitation anomaly (mm/day) from idealized runs forced with observed March-May SST anomalies averaged over 1999-2010 for the tropical Indian Ocean only. • As in b, but for model runs forced with SSTs only for the tropical Pacific. Top legend only for a); bottom legend for b and c. SST Anomalies used to drive the model Side shows research by Bradfield Lyon (IRI) presented by TufaDinku (IRI) at the CRAM3
CCA(Forecast SSTs) Figure x. Relative forecast probabilities of below normal rainfall, based on ECHAM4.5 and CCM3.6 models driven with forecast sea surface temperatures. The probability of below normal rainfall in 2012 appears broadly similar to these analog years. Analysis provided by Bradfield Lyon, International Research Institute for Climate and Society.
SST based Analog Analysis Pacific and Indian Ocean SST indices.
Analog years analysis for April & May Chris Funk: 2000, 2008 & 2011 KMD: 2001 & 2009 Key messages: Consistent observations of increased likelihood for poor rainfall performance over northern and central Tanzania, southern, central, eastern and northern Kenya, together with Somali and Afar regions of Ethiopia (<75% of normal) . Emerging areas of concern in Rwanda and Burundi during the months of April and May, with mixed rainfall performance likely in south and central Somalia.
Analog years analysis for Maize WRSI/EoS 2011 2008 2000 Key messages: Increased likelihood (80% chance ) for crop failure in SE and coastal strip of Kenya, S. Somalia and N. Tanzania. 100% likelihood for near normal cropping conditions for key agric areas of Kenya and Uganda. About 60% likelihood for normal cropping conditions in Rwanda and Burundi. Mixed crop performance for Meher/Belg cropping areas despite delayed onset(?) 2001 2009
Analog years analysis for Rangelands WRSI/EoS 2011 2008 2000 2001 2009 Key messages: Mixed performance in rangeland conditions in the region, due to expected poor rainfall distribution in space and time over the key pastoral areas. Increased likelihood for poor rangeland conditions over N. and S. Kenya, Somali region of Ethiopia and parts of Somaliland, Djibouti and S. Eritrea.
Proposed Climate Projection/Forecast System Winds Rainfall Temperature Observed & predicted SSTs Climate Models Hoerling/Hurrel Decadal SST predictions PET z ObsRainfallTS CA CCA MFR ... T z PETobsm,s Additional (Filtered CMIP5)SST predictions GHGs Tobsm,s FutureRainfallTS Probs Future TempTS Probs Future PETTS Probs SPI FLDAS WRSI