Download

1 / 27
270 likes | 442 Views
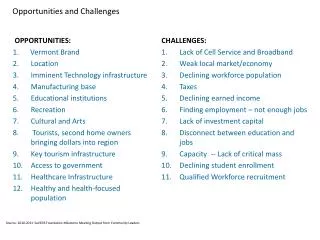
ETF - New Opportunities and Challenges. Deborah Fuhr, Independent Strategist debbie.fuhr@gmail.com Linkedin ETF Network

E N D
ETF - New Opportunities and Challenges Deborah Fuhr, Independent Strategist debbie.fuhr@gmail.com Linkedin ETF Network All views and comments are my own and are intended to be educational and not a solicitation to buy or sell any securities. I own shares in Vanguard Emerging Market ETF VWO US Sources, Bloomberg, ICI, McKinsey, Bank of New York Mellon, ESMA, BIS, IMF, FSB, Strategic Insight, World Federation of Exchanges, Charles Schwab, October 30, 2011 Private & Confidential
Exchange Traded Funds Exchange Traded Funds - ETFs - at a cross road Exchange Traded Funds – are one of the greatest and most beneficial financial innovations in the past 25 years for both retail and institutional investors globally. They are funds, which are easy to use, simple, cost efficient, diversified, providing real-time access to many asset classes in a transparent fashion ETFs are not the same as ETNs, ETCs, ETVs and ETPs Discuss current landscape Challenges What needs to be done Private & Confidential
Some history 1940 first active mutual fund 1975 first index mutual fund 1990 first ETF was launched in Canada 1993 first ETF launched in the USA 1999 33 ETFs $40 bn + 2 ETPs $2 billion 2000 first ETF launched in Europe 2005 UCITS iii – synthetic ETFs 2007 Synthetic ETF cross listed in Hong Kong 2010 – 2011 – Regulators express concerns Private & Confidential
End of Q3 Snapshot: Global Source: Bank of Israel, Bloomberg. GLOBAL ETF INDUSTRY GLOBAL ETF & ETP INDUSTRY • At the end of Q3 2011, the global ETF industry had 2,916 ETFs, with 6,523 listings, assets of US$1,248.0 Bn, from 152 providers on 50 exchanges. • Overall, ETF assets are down 4.8% from US$1,311.3 Bn at year end 2010 to US$1,248.0 Bn at the end of Q3 2011. • In the third quarter of 2011, ETFs saw net inflows of US$35.4 Bn. • Fixed income ETFs saw US$14.9 Bn net inflows, equity ETFs saw US$9.7 Bn net inflows and commodity ETFs saw US$4.5 Bn net inflows. • iShares and Vanguard gathered the largest net inflows, each with US$7.1 Bn, followed by State Street Global Advisors with US$5.6 Bn net inflows. • Lyxor Asset Management experienced the largest net outflows with US$4.0 Bn. • Leveraged ETFs saw US$5.0 Bn net inflows, inverse ETFs saw US$2.0 Bn net inflows and leveraged inverse ETFs saw US$0.3 Bn net inflows. • 96 new ETFs were listed in Q3 2011, with eight new providers entering the industry for the first time, while six ETFs were de-listed. • MSCI has the largest amount of ETF assets tracking its benchmarks, with US$287.7 Bn, followed by S&P with US$276.9 Bn, and Barclays Capital with US$134.7 Bn. • Including other Exchange Traded Products (ETPs), at the end of Q3 2011, the global ETF/ETP industry had 4,131 ETFs/ETPs, with 8,385 listings, assets of US$1,430.2 Bn, from 186 providers on 53 exchanges. • Overall, ETF/ETP assets are down 3.5% from US$1,482.7 Bn at year end 2010 to US$1,430.2 Bn at the end of Q3 2011. • In the third quarter of 2011, ETFs/ETPs saw net inflows of US$38.0 Bn. • Fixed income ETFs/ETPs saw US$15.0 Bn net inflows, equity ETFs/ETPs saw US$10.1 Bn net inflows and commodity ETFs/ETPs saw US$7.1 Bn net inflows. • iShares gathered the largest net inflows with US$8.7 Bn, followed by Vanguard with US$7.1 Bn net inflows and State Street Global Advisors with US$6.8 Bn net inflows. • Lyxor Asset Management experienced the largest net outflows with US$4.0 Bn. • Leveraged ETFs/ETPs saw US$5.1 Bn net inflows, inverse ETFs/ETPs saw US$2.6 Bn net inflows and leveraged inverse ETFs/ETPs saw US$0.3 Bn net inflows. • 126 new ETFs/ETPs were listed in Q3 2011, with eight new providers entering the industry for the first time, while 11 ETFs/ETPs were de-listed. • MSCI has the largest amount of ETF/ETP assets tracking its benchmarks, with US$288.4 Bn, followed by S&P with US$284.3 Bn, and Barclays Capital with US$135.0 Bn. 3
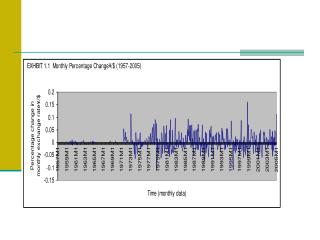
Source:, Bank of Israel, Bloomberg. ETF/ETP Asset Growth: Global Assets (US$ Bn) # Products
GLOBAL UNITED STATES EUROPE CANADA ASIA PACIFIC (EX-JAPAN) JAPAN LATIN AMERICA MIDDLE EAST AND AFRICA Source:, Bank of Israel, Bloomberg. ETF/ETP Asset Growth by Region ETF ETP
Source:, Bloomberg, National Stock Exchange (NSX). Top 20 ETFs by Assets: Global TOP 20 ETFs BY ASSETS TOP ETFs as a % of TOTAL ASSETS
Source: Bloomberg, National Stock Exchange (NSX). Top 20 ETFs by Average Daily Trading Volume: Global TOP 20 ETFs BY AVERAGE DAILY TRADING VOLUME TOP 20 ETFs as a % of TOTAL ADV
Source:, Bloomberg. Top 20 Exchanges by Average Daily Trading Volume: Global TOP 20 EXCHANGES BY AVERAGE DAILY TRADING VOLUME AVERAGE DAILY VOLUME BY COUNTRY/REGION
Source: Bloomberg, National Stock Exchange (NSX). Top 20 ETFs by Q3 2011 Net Inflows: Global TOP 20 ETFs BY Q3 2011 NET INFLOWS TOP 20 ETFs as a % of TOTAL NET INFLOWS
Source: Bloomberg, National Stock Exchange (NSX). Top 20 ETF Providers by Assets: Global LARGEST ETF PROVIDERS as a % of TOTAL ASSETS % of Assets
Source: Bloomberg. Top 20 ETF Index Providers: Global LARGEST ETF INDEX PROVIDERS as a % of TOTAL ASSETS % of Assets
Source:, Bloomberg. ETFs/ETPs by Asset Class: Global
Note: Individual product assets for ETPs in Israel are not available. An aggregate asset value for all ETPs listed in Israel as of August 2011 (latest available) has been added to the total. Source: Bloomberg, Bank of Israel. ETFs/ETPs by Asset Class: Global (continued)
End of Q3 Snapshot: Europe Source:, Bloomberg. EUROPEAN ETF INDUSTRY EUROPEAN ETF & ETP INDUSTRY • At the end of Q3 2011, the European ETF industry had 1,208 ETFs, with 4,245 listings, assets of US$266.7 Bn, from 39 providers on 22 exchanges. • Overall, ETF assets are down 6.1% from US$284.0 Bn at year end 2010 to US$266.7 Bn at the end of Q3 2011. • In the third quarter of 2011, ETFs in Europe saw net inflows of US$6.2 Bn. • Equity ETFs saw US$3.3 Bn net inflows and US$1.3 Bn net inflows went into both commodity and fixed income ETFs. • iShares gathered the largest net inflows with US$5.8 Bn, followed by UBS Global Asset Management and db x-trackers each with US$1.0 Bn net inflows. • Lyxor Asset Management experienced the largest net outflows with US$3.8 Bn. • Leveraged ETFs saw US$0.9 Bn net inflows, inverse ETFs saw US$0.2 Bn net inflows, while leveraged inverse ETFs experienced US$0.2 Bn net outflows. • 24 new ETFs were listed in Q3 2011. • STOXX has the largest amount of ETF assets tracking its benchmarks, with US$79.7 Bn, followed by MSCI with US$57.5 Bn, and Markit in third with US$20.6 Bn. • Including other Exchange Traded Products (ETPs), at the end of Q3 2011, the European ETF/ETP industry had 1,763 ETFs/ETPs, with 5,360 listings, assets of US$299.8 Bn, from 46 providers on 23 exchanges. • Overall, ETF/ETP assets are down 4.9% from US$315.3 Bn at year end 2010 to US$299.8 Bn at the end of Q3 2011. • In the third quarter of 2011, ETFs/ETPs in Europe saw net inflows of US$6.8 Bn. • Equity ETFs/ETPs saw US$3.3 Bn net inflows, commodity ETFs/ETPs saw US$1.9 Bn net inflows and fixed income ETFs/ETPs saw US$1.3 Bn net inflows. • iShares gathered the largest net inflows with US$5.9 Bn, followed by UBS Global Asset Management and db x-trackers each with US$1.0 Bn net inflows. • Lyxor Asset Management experienced the largest net outflows with US$3.8 Bn. • Leveraged ETFs/ETPs saw US$0.9 Bn net inflows, inverse ETFs/ETPs saw US$0.2 Bn net inflows, while leveraged inverse ETFs/ETPs experienced US$0.2 Bn net outflows. • 27 new ETFs/ETPs were listed in Q3 2011. • STOXX has the largest amount of ETF/ETP assets tracking its benchmarks, with US$79.9 Bn, followed by MSCI with US$57.6 Bn, and Markit in third with US$20.6 Bn. 3
Source:, Bloomberg. ETF/ETP Asset Growth: Europe Assets (US$ Bn) # Products
Source: Bloomberg. Top 20 ETFs by Assets: Europe TOP 20 ETFs BY ASSETS TOP ETFs as a % of TOTAL ASSETS
Source Bloomberg. Top 20 ETFs by Average Daily Trading Volume: Europe TOP 20 ETFs BY AVERAGE DAILY TRADING VOLUME TOP 20 ETFs as a % of TOTAL ADV
Source: Bloomberg. Top 20 ETFs by Q3 2011 Net Inflows: Europe TOP 20 ETFs BY Q3 2011 NET INFLOWS TOP 20 ETFs as a % of TOTAL NET INFLOWS
Source: Bloomberg. Top 20 ETF Providers by Assets: Europe LARGEST ETF PROVIDERS as a % of TOTAL ASSETS % of Assets
Source: Bloomberg. Top ETF Providers by Assets, Split by Replication Type Physical ETFs Synthetic ETFs All ETFs
Source: Bloomberg. ETF Index Providers: Europe LARGEST ETF INDEX PROVIDERS as a % of TOTAL ASSETS % of Assets
Source:, Bloomberg. ETFs/ETPs by Asset Class: Europe
Source: Bloomberg. ETFs/ETPs by Asset Class: Europe (cont.)
How ETFs are Used Equitise cash Core/satellite Market exposure Cash management Rebalancing Hedge Private & Confidential
Opportunities Multi-asset class investing is growing Pension products are allowing ETFs Fee based advisory business and direct retail Bank of New York Mellon/Strategic Insight – among 30,000 financial advisors - 28% of wrap accounts are ETFs Charles Schwab – Rest of world – products pay for distribution but there is a move to fee based advisory – global trend RDR – Retail Distribution Review UK Australia Belgium Private & Confidential
Thank you Thank you Any questions Deborah Fuhr, Independent Strategist debbie.fuhr@gmail.com Linkedin ETF Network All views and comments are my own and are intended to be educational and not a solicitation to buy or sell any securities. I own shares in Vanguard Emerging Market ETF VWO US Sources, Bloomberg, ICI, McKinsey, Bank of New York Mellon, ESMA, BIS, IMF, FSB, Strategic Insight, World Federation of Exchanges, Charles Schwab, October 30, 2011 Private & Confidential