Download
1 / 17
180 likes | 311 Views
Experiment Dashboard overviw of the applications. Julia Andreeva SDC-MI section meeting 07.05.2013. Main areas of the monitoring activities. Monitoring of the computing activities of the LHC VOs .

E N D
Experiment Dashboardoverviw of the applications Julia Andreeva SDC-MI section meeting 07.05.2013
Main areas of the monitoring activities • Monitoring of the computing activities of the LHC VOs . • Monitoring of the sites and services from the VO perspective, i.e. evaluating status of sites and services based on metrics defined by the VOs • Providing cross-VO global picture of the LHC activities on the WLCG infrastructure
Development strategy • Whenever possible apply cross-VO, cross-middleware solutions. Even starting to develop an application on the request of a single experiment aim to make it generic and easily adapted for others. As a result monitoring solutions provided by Dashboardare shared between several LHC experiments and are not coupled with a particular service, middleware flavor or a particular implementation of the workload management or data management systems • UIs are designed with strong involvement of the potential users • All information is available in machine-readable format
ES monitoring activities U Operation teams Sites \ Sites Data management monitoring Users General public Data transfer Data access Publicity & Dissemination Monitoring of the job processing WLCG Google Earth Dashboard Infrastructure monitoring Opera- tion teams Analysis Production Real time and historical views Operation teams Site Status Board Site usability SiteView Sites Sites
ES monitoring activities U Operation teams Sites \ Sites Data management monitoring Users General public Data transfer Data access Publicity & Dissemination No overlap with any monitoring effort in IT apart of Site usability which is based on the results of SAM tests and correspondingly there is a synergy with MyWLCG portal Monitoring of the job processing WLCG Google Earth Dashboard Infrastructure monitoring Opera- tion teams Analysis Production Real time and historical views Operation teams Site Status Board Site usability SiteView Sites Sites
JOB monitoring (1) • Shared by CMS and ATLAS though information sources are different. Experiment workflows are instrumented to report job monitoring information. In case of ATLAS data is regularly imported from Panda server. • Multiple UI dedicated to various user categories and usecases running on top of the single data repositories • Demanding applications from the point of view of scalability. ATLAS submits up to 1 million jobs daily, CMS submits 300-600 K jobs daily. • DB contains processing details for every job
JOB monitoring (2) • Interactive view (what is happening now): CMS http://dashb-cms-job.cern.ch/dashboard/templates/web-job2/# ATLAS http://dashb-atlas-job.cern.ch/dashboard/templates/web-job2/# Used by members of various computing projects ( like production team, analysis support), VO managers, site administrators. In machine-readable format data is imported into Site Status Board, WLCG Google Earth Dashboard, SiteView, local fabric Uses raw , non aggregated data • Historical view (accounting portal). Shows job processing metrics as function of time for any time ranges. Uses aggregated data CMS http://dashb-cms-job-dev.cern.ch/dashboard/request.py/dailysummary ATLAS http://dashb-atlas-job.cern.ch/dashboard/request.py/dailysummary Similar usage as for the interactive view. Weekly distributions of this application are reviewed during CMS facilities operations meetings, dataops meeting, Tier1 and Tier2 coordination meetings No overlap with any monitoring effort in IT.
JOB MONITORING (3) • Task monitoring, user–centric application for analysis users. CMS http://dashb-cms-job-task.cern.ch/dashboard/request.py/taskmonitoring ATLAS two slightly different applications for analysis and production, customized for particular user category Production: http://dashb-atlas-task-prod.cern.ch/templates/task-prod/# Analysis: https://dashb-atlas-task.cern.ch/templates/task-analysis/# Task monitoring application is widely used in CMS (150-250 distinct users daily ~75% of all analysis users). Target community : physicists running their analysis jobs on any execution backend (GRID or local farm) , analysis support team, sometime site administrators when they need to understand better what user is doing at their site. ATLAS task monitoring was recently introduced to the user community. New version of User Analysis Task Monitoring and Production Task Monitoring using a common framework (hbrowse) implemented in jQuery. Possibility not only to monitor , but so to handle user jobs via UI (killing jobs). No overlap with any monitoring effort in IT.
Data management monitoring (1) • Multiple applications , from the implementation point of view all of them have common core part (common DB schema, aggregation, UI) initially developed for ATLAS DDM Dashboard: - ATLAS DDM Dashboard - WLCG Transfer Dashboard - FAX and AAA Dashboards
ATLAS DDM Dashboard http://dashb-atlas-data.cern.ch/ddm2/ Heavily used by ATLAS computing community (up to 1500 unique visitors (IP addresses) per month, 10-20K pages are viewed daily) Used by members of data management team, ATLAS computing shifters. In machine-readable format data is imported into WLCG Google Earth, Site View, Site Status Board No overlap with any monitoring effort in IT.
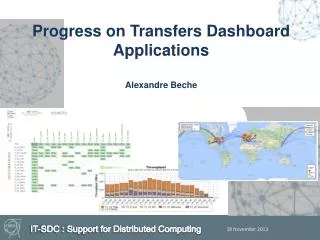
WLCG Transfer Dashboard • Cross-VO and cross-technology monitoring system which provides global data transfer picture on the WLCG infrastructure http://dashb-wlcg-transfers.cern.ch/ui/ • Monitors data transfers performed by FTS and data traffic on the xrootd federated storage (ATLAS,ALICE and CMS) • In production since June 2012 • 50-100 unique visitors daily • Development process is ongoing, functionality is being extended No overlap with any monitoring effort in IT.
AAA and FAX dashboard • Provides single entry point for all monitoring information about data traffic and data access on a given xrootd federation. Includes EOS data both for ATLAS and CMS. http://dashb-cms-xrootd-transfers.cern.ch/ui/# http://dashb-atlas-xrootd-transfers.cern.ch/ui/# • Information sources are the same as for the the WLCG transfer Dashboard, but AAA and FAX Dashboards provide much more detailed view in particular what concerns data access. WLCG Transfer Dashboard does not include EOS data. • Used by people operating federations, site administrators, LHC VO computing teams • Development process is ongoing, functionality is being extended No overlap with any monitoring effort in IT.
Monitoring of the infrastructure from the VO perspective (1) • Site Status Board Evaluates status of the distributed sites and services used by a particular VO from various perspectives. VOs are free to define monitoring metrics (status and numeric), time range for their update, their criticality and customized views. Shares a lot of implementation with Site View and Site usability applications. Snapshot and historical distributions are available. Some metrics are standard and built in the SSB (downtime info taking into account experiment topology, results of service types defined as critical by VO, whether site/service is visible in BDII…). Knowledge about experiment topology is built in the SBB schema. Enabled for all 4 LHC experiments. Actively used by CMS and ATLAS for the distributed computing shifts and site evaluation and commissioning.. Data in machine-readable format is imported in fabric monitoring, site readiness , site blacklisting for production and analysis , etc… Used by people taking part in the computing shifts, site administrators, VO managers, analysis support and analysis users in order to understand whether a particular site has a problem and has to be blacklisted, etc… CMS http://dashb-cms-ssb.cern.ch/dashboard/request.py/siteviewhome ATLAS http://dashb-atlas-ssb.cern.ch/dashboard/request.py/siteviewhome No overlap with other monitoring effort in IT. Though the concept is similar to SLS which is used by experiments to monitor CERN central services . Visualization is different , scope is different and SSB data structure is driven by the VO topology
Monitoring of the infrastructure from the VO perspective (2) • Site usabilitymonitor (SUM) Based on the results of SAM tests. The application provides estimates the quality of service running at thesites as it is evaluated by the VOsExperimentswanted to be able to test sites for different usecases and correspondingly to have multiple profiles for site evaluation (in terms of set of critical service types, set of critical metrics, etc…). The application is actively used by the LHC experiments for daily operations and site commissioning activity, namely by members of the computing projects, site administrators, VO managers. The distributions for Tier1 are considered among the key metrics at the daily WLCG meetings and are included in the weekly reports to the MB. Data in machine-readable format is imported to the local fabrics monitoring, Site Status Board, SiteView, CMS Site Readiness. When SAM infrastructure started to be redesigned, it was agreed with SAM that availability calculation won’t be any more implemented by the Dashboard extension in SAM and Dashboard won’t query involved DBs directly. Dashboard interface was preserved since experiments relied on it and it was integrated in the experiment-specific systems. Data for the Dashboard UI isretrieved from SAM via new SAM pi. There is an overlap with MyWLCG portal which has not yet been evaluated by the experiments
Various accounting portals • Several accounting portals with experiment-specific information sources were developed based on the Job monitoring historical view - ATLAS DDM accounting - PD2P monitoring - CMS Condor monitoring …. No overlap with any monitoring effort in IT.
Global view of the LHC activities on the WLCG infrastructure WLCG Google Earth Dashboard Life ~real-time monitor of the job processing and data transfer of the LHC experiments performed on WLCG. Mostly for publicity and dissemination purposes. Uses experiment-specific monitoring systems (Phedex, Dirac, MonAlisa repository for ALICE) and Experiment Dashboard as information sources. Using data retrieved from these sources every 10 minutes Dashboard server generates input file for the Google Earth client. Runs at several WLCG computing centers including CERN (CC, Globus permanent exhibition, ATLAS computing room). Is being demonstrated at various conferences and public events. No overlap with any monitoring effort in IT.
Global view of the LHC activities on the WLCG infrastructure • SiteView Aims to provide the overall picture of the computing activities of the LHC VOs at a particular site. At the time being is not actively used. Because of the lack of manpower no sufficient effort was put into it in order to validate it both by experiments and site admins. Google Earth Dashboard is linked to it in order to provide a detailed picture of what is going on at a particular site: http://dashb-siteview.cern.ch/dashboard/siteview/index.html No overlap with any monitoring effort in IT.