Using Groundwater and Surface Water Models for the Marcus Hook Refinery
100 likes | 307 Views
Using Groundwater and Surface Water Models for the Marcus Hook Refinery. CE 394K.2 Surface Water Hydrology Presented by Julie Kim April 29, 1999. Marcus Hook Refinery, Pennsylvania Lube Area, southwestern part of the facility Marcus Hook Creek (MHC). Study Area. Objectives.

Using Groundwater and Surface Water Models for the Marcus Hook Refinery
E N D
Presentation Transcript
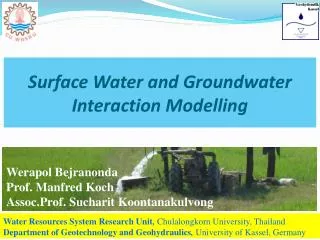
Using Groundwater and Surface Water Models for the Marcus Hook Refinery CE 394K.2 Surface Water Hydrology Presented by Julie Kim April 29, 1999
Marcus Hook Refinery, Pennsylvania Lube Area, southwestern part of the facility Marcus Hook Creek (MHC) Study Area
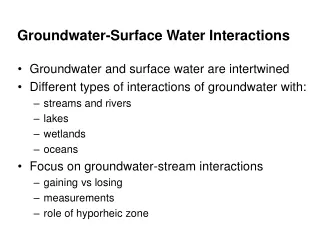
Objectives • To incorporate results from GW model into SW model • To calculate GW target level (CGW) so concentrations in SW are not above applicable SWQS (CSTD) in MHC • To compare SW model predictions for stream flow with actual stream gauging results from USGS
Act 2 requirements for diffuse GW modeling and mixing calculations (PADEP) CSTD: Water quality criteria for eight COCs (PADEP) Historical daily streamflows for PA (USGS) GW, SW, and WW flows from A. Romanek’s GW and SW models Max concentrations of COCs from spatial analysis Data Sources
Methodology • Simple mass balance according to Act 2 CGW = CSTD * QSW / 2q where CGW = target level GW concentration CSTD = SWQ criteria QSW = Qharmonic for carcinogens or 7Q10 for non carcinogens 2q = GW flow from both sides of MHC
No water data for MHC Use 66-years of historical daily flow values for Chester Creek (CC) located in the same basin (Lower Delaware) Estimate streamflows for MHC by using simple drainage area ratio QMHC = QCC * AMHC / ACC Calculate Qharmonic for carcinogens Harmonic mean flow = Total number of samples Sum of the reciprocal of flow Methodology
Methodology • Use frequency analysis to calculate 7Q10 for non carcinogens • Calculate mean of flows of 7 consecutive days for all data • Calculate minimum flow during a 1-year period for all flows • Sort minimum flows in descending order and rank • Use Gringorten’s formula to calculate exceedance probability (b=0.44) • Calculate return period • 7Q10 corresponds to the minimum flow with a 10-year return period
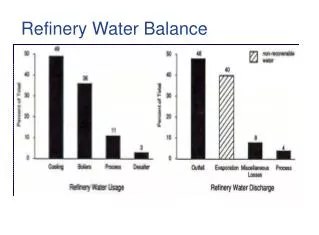
Results • Benzene measured in the Lube Area was above the target GW concentration • Additional analyses should be conducted • Measured peak concentrations of other COCs were below CGW • Likely that no further action is warranted • Total Qharmonic = 8.76 cfs • Total 7Q10 = 7.51 cfs • USGS-based flow is close to SW model’s regional flow of 7.7 cfs
Future Work • Conduct additional analyses for COCs whose concentrations were above CGW • Fate and transport modeling using GW concentrations other than maximum concentrations • More sophisticated GW-SW interaction models