Download
1 / 20
200 likes | 224 Views
Explore the fascinating world of spectral lines and electron energy levels, from ground states to excited states, as atoms absorb and emit light energy. Learn about Kirchhoff's Laws, emission and absorption spectra, Balmer equation, blackbody radiation, Planck and Einstein's contributions, and the photoelectric effect. Delve into the intriguing results of the double-slit experiment and the wave-particle duality of light and electrons. Uncover the fundamental principles that govern the behavior of light and matter at the quantum level in this enlightening journey through the wonders of quantum physics.

E N D
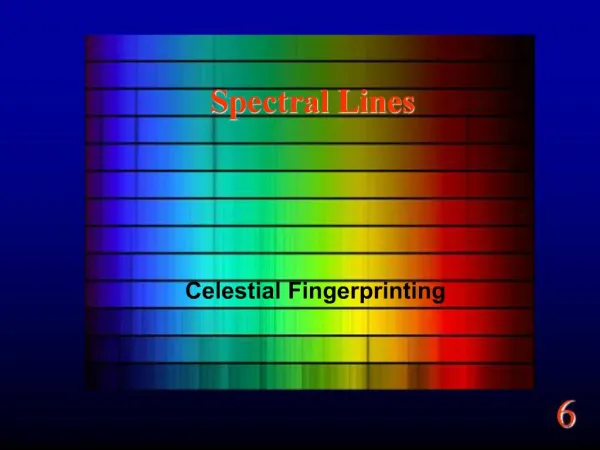
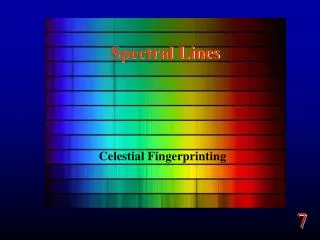
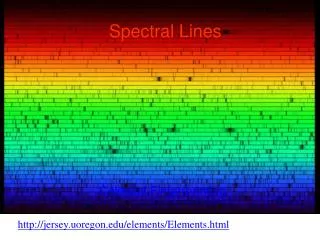
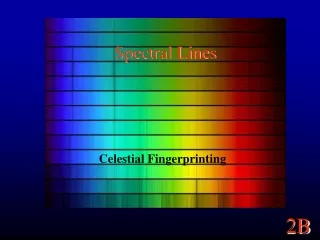
Spectral Lines 3.2
Spectral Line formation? • Electron has different energy levels: Floors in a building. • Lowest is called the Ground State. • Higher states are Excited States.
Changing Levels • If you add the RIGHT amount of energy to an atom, the electron will jump up energy floors. • If the electron drops down energy floors, the atom gives up the same amount energy. • From before, LIGHT IS ENERGY: E = hc/l
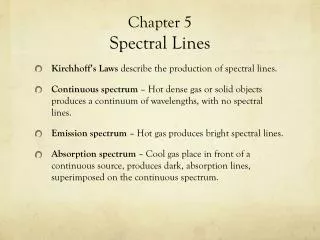
Kirchhoff’s Laws • Light of all wavelengths shines on an atom. • Only light of an energy equal to the difference between “floors” will be absorbed and cause electrons to jump up in floors. • The rest of the light passes on by to our detector. • We see an absorption spectrum: light at all wavelengths minus those specific wavelengths.
Kirchhoff’s Laws Cont… • Excited electrons, don’t stay excited forever. • Drop back down to their ground floors. • Only light of the precise energy difference between floors is given off. • This light goes off in all directions. • From a second detector, we see these specific energy wavelengths: an emission spectrum.
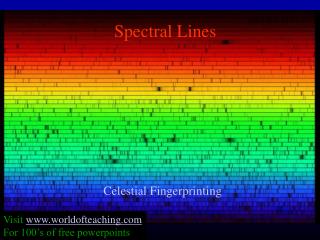
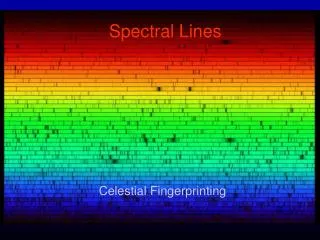
Emission Lines • Every element has a DIFFERENT finger print.
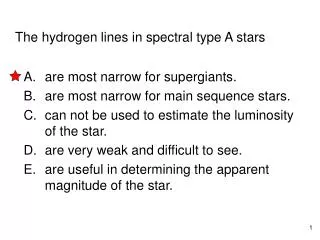
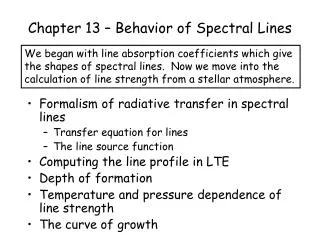
Emission and Absorption spectra • The lines represent jumps or leaps from one energy level to another • Lines can be sharp or blurry • Blurry lines were later discovered to be a group of very close lines…some energy levels were very close in energy yet different • Later some of the blurry lines were found to respond to magnetic fields….implication is that orbits have 3-D orientation in space
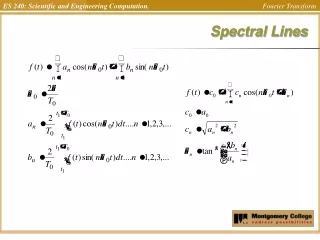
Balmer equation • 1/λ= RH (1/nf2 – 1/ni2) • Correctly predicts all the 4 lines for the hydrogen atom (only hydrogen) • λ= wavelength of light in metres • RH- Rydberg constant 1.10 x 10⁷ m-1 • nf= final energy level (once returned) • ni= initial energy level (once excited)
Blackbody radiation- Planck • First result after Bohr that was problematic for physicists • A blackbody is a solid object that is heated until it begins to glow (first red then blue then white hot) and then allowed to return to thermal equilibrium slowly • If the intensity or brightness of the different colours that is emitted is plotted a BELL shaped curve is seen…not what was expected!
Interpretation • Higher energy (UV) has a higher peak, lower ernergy (IR) has a lower peak • According to classical physics, it should not be bell shaped but should be a exponential decay kind of curve. Starting high up on the left and going down and to the right like a hockey stick • That means that light emitted from a cooling object is like light, it is made up of chunks like light is made of particles called photons. • Einstein concurred and interpreted the results as meaning energy comes in quanta
Planck and Einstein • E= hf = hc/λ • Energy of the photon of light (J) • h= Planck’s constant 6.63 x 10⁻³⁴Js or 4.14 x 10⁻¹⁵ eVs • c= speed of light (3.00 x 10⁸ m/s) • λ= wavelength of light (m)
Explanation of Photoelectric Effect • In the photoelectric effect, electrons of metals are ejected when light shines on them • However, not all wavelengths of light will cause the photoelectric effect • Red light has no photoelectric effect on potassium • Yellow light causes this effect on potassium
What does it mean? • Einstein interpreted the results and said that energy at the atomic level is in chunks. Only certain energies are allowed • The intensity of the light affects how many electrons jump but does not affect the speed of the electrons once they leave the surface • Frequency (and wavelength) are key. Threshold frequencies are observed for different materials • Minimum energy required to bump an electron off its orbit. If more is delivered, the electron leaves with a faster speed from the surface • Energy is quantized (quanta) • (Photoelectric effect like solar panel!)
Double slit experiment • Results indicated that light which was supposed to be a particle was behaving as a wave • Diffraction of the electrons through the double slit matches wave patterns. • Electron is not a particle but a smear. It’s location cannot be known for certain unless you measure it. • Einstein (God does not play dice) • Bohr (Do not tell God what to do)