Spectral Lines and Fourier Transform for Signal Analysis
170 likes | 201 Views
Explore spectral lines for frequency analysis, amplitude, and phase details, distinguishing signals like speech. Understand Fourier Transform for aperiodic signals, continuous/discrete options, and renowned transforms like Gaussians. Learn about Fast Fourier Transform (FFT) efficiency and perform FFT in MATLAB for detailed signal spectrum analysis.

Spectral Lines and Fourier Transform for Signal Analysis
E N D
Presentation Transcript
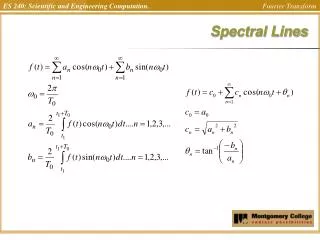
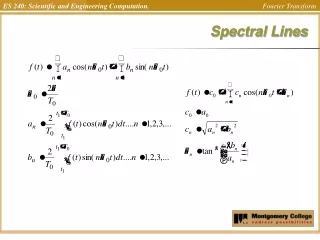
Spectral Lines • Gives the frequency composition of the function • Amplitude, phase of sinusoidal components • Could provide information not found in time signal • E.g. Pitch, noise components • May help distinguish between signals • E.g speech/speaker recognition
Spectral Lines Example QUESTIONS -- DC Yes____ ao = ? No_____ ao = 0 Symmetry Even____ an = ? bn = 0 Odd____ an = 0 bn = ? Nether even nor odd ____ an = ? bn = ? Halfwave symmetry Yes_____ only odd harmonics No______ all harmonics Discontinuities Yes_____ proportional to1/n No______ proportional to1/n2 Note ? means find that variable. Comment on the general form of the Fourier Series coefficients [an and/or bn.] X X X X
The Fourier Transform • Applied to aperiodic signals • Could be continuous or discrete • Why Transform and not series? • Do we want continuous or discrete?
The Fourier Transform • Continuous Fourier Transform:
The Fourier Transform • The Discrete Fourier Transform:
Famous Fourier Transforms Sinusoid Delta function
Famous Fourier Transforms Gaussian Gaussian
Famous Fourier Transforms Sinc function Square wave
Famous Fourier Transforms Exponential Lorentzian
Fast Fourier Transform • The Fast Fourier Transform (FFT) is a very efficient algorithm for performing a discrete Fourier transform • FFT principle first used by Gauss in 18?? • FFT algorithm published by Cooley & Tukey in 1965 • In 1969, the 2048 point analysis of a seismic trace took 13 ½ hours. Using the FFT, the same task on the same machine took 2.4 seconds!
FFT in matlab • Assign your time variables • t = [0:255]; • Assign your function • y = cos(2*pi*n/10); • Choose the number of points for the FFT (preferably a power of two) • N = 2048; • Use the command ‘fft’ to compute the N-point FFT for your signal • Yf = abs(fft(y,N)); • Use the ‘fftshift’ command to shift the zero-frequency component to center of spectrum for better visualization of your signals spectrum • Yf= fftshift(Yf); • Assign your frequency variable which is your x-axis for the spectrum • f = [-N/2:N/2-1]/N; - this is the normalized frequency symmetrical about f0 and about the y-axis • Plot the spectrum • plot(f, Yf)
FFT in matlab • Vary the fundamental frequency and see what happens