Download
1 / 30
380 likes | 870 Views
ROAD TRANSPORT AND ITS IMPACTS ON ENVIRONMENT AND HEALTH. Dr. Mohammed Raza Mehdi. NED UNIVERSITY OF ENGINEERING AND TECHNOLOGY, KARACHI . INTRODUCTION.

E N D
ROAD TRANSPORT AND ITS IMPACTS ON ENVIRONMENT AND HEALTH Dr. Mohammed Raza Mehdi NED UNIVERSITY OF ENGINEERING AND TECHNOLOGY, KARACHI
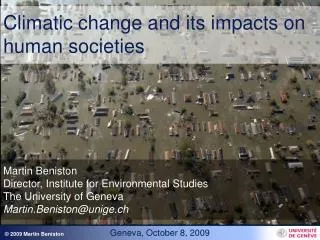
INTRODUCTION • The environmental impact of transport is because it is a major user of energy, and burns most of the world's petroleum. This creates air pollution, including nitrous oxides and particulates, and is a significant contributor to global warming through emission of carbon dioxide, for which transport is the fastest-growing emission sector. By subsector, road transport is the largest contributor to global warming.
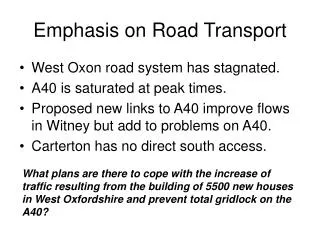
An increase in Road Traffic leads to adverse effects on environment. • These effects may include Air Pollution, Noise Pollution and Habitat Fragmentation. • Here we are going to discuss about the first two i.e. Air and Noise Pollution.
At large, it is globally acceptable that air pollution has serious impacts on human health and causes various disorders. Repetitive occurrence and intensive incidence of diseases in the vicinity of highly polluted zones particularly, ascertain the distinct association of diseases/disorders and air pollution.
The diseases that emerged as highly associated with air pollution are mostly the disorder of respiratory system
The respondents of survey were largely suffering from Headache, Hypertension, Eye ailments, Chronic Influenza, Stress and Tonsillitis. While Nausea, Chronic Cough, Hearing Loss, Learning Loss and Palpitation were prevalent disorders to a lesser extent found in the respondents.
MORBIDITY AND MORTALITY • Morbidity (meaning "sick, unhealthy") is a diseased state, disability, or poor health due to any cause. The term may be used to refer to the existence of any form of disease, or to the degree that the health condition affects the patient. • Mortality is a ratio of the number of deaths (in general, or due to a specific cause) in a population, scaled to the size of that population, per unit of time.
Table 2: Indoor Morbidity and Mortality Statistics 2001 in Karachi Data Source: Medical Record and Statistical Office, Civil Hospital, Karachi
The analysis zones determined by the then Karachi Development Authority served as the precinct of metropolitan Karachi. Figure 2 maps the disease occurrence for Karachi. The higher occurrence of air pollution based diseases in the study area was in the district Karachi Central, specifically, North Karachi (Zone # 31), F. C. Area and Mansoora / F B Area (Zone #28). The affected zones of district Karachi East were Garden, Soldier Bazaar, Jamshed Quarters (Zone #11), Korangi (Zone#39), Landhi Colony (Zone#40) and Akhtar and Baloch Colony, Chanesar Goth (Zone #25). In district Karachi South, which comprises of mostly the old city (core) localities of Karachi, Saddar and Artillery maidan (Zone # 3) had the highest occurrence of airborne diseases. Orangi, Metroville-I (Zone#30) of district Karachi West posses a significant disease problem.
Table 2 : Indoor Morbidity and Mortality Statistics of Airborne Diseases 2000 and 2001 in Karachi Data Source: Statistical Department, Jinnah Post Graduate Medical Centre, Karachi.
EPIDEMIOLOGICAL EVIDENCE • Air pollution contributes to mortality and morbidity. • Thousands of patients are daily catered at the Out Patient and Emergency departments. • More than two thousands Indoor patients have been found affected by air-induced disorders in last two years.
Noise is continuous nuisance in the urban areas of both developed and developing countries and seriously affects the environmental quality of exposed people. Karachi as one of the growing cities of the world, producing high noise levels, which are seriously damaging the environmental quality.
We selected 308 sites at major junctions to measure levels of noise exposure and to monitor the volumes of traffic. Karachi city experienced severe traffic congestions around those intersections. Field survey was conducted during morning, afternoon and evening for two weeks. Each intersection was geocoded in ArcGIS 9.3 The survey period represented normal traffic volume excluding holiday seasons such as Ramadan, Eid, etc. The levels of road traffic noise were collected with Noise Dosimeter (Micro-14, Quest Technologies, U.S.A.). We created noise surface maps of each time period from the field measurements to provide a view of noise exposure levels for non-measured areas within Karachi City.
Noise levels at different days and times (a) weekday morning, (b) weekday afternoon, (c) weekday evening, (d) weekend morning, (e) weekend afternoon and (f) weekend evening.
On the resultant risk map, there are 4 significant regions of very high-risk in red colour identified as A, B C and D. These include core /old city areas of the Karachi (i.e. Saddar / Empress market) and sections adjacent to the 4 chief arterials of Karachi.( M. A. Jinnah , Shr-e Faisal, Liaqatabad and University Roads) . The deduced very high risk region (VHRR) is characterized by bus terminals/transfer station, dense network of roads, crowded retail markets, thousands of commuters, a lot of pedestrians, long queued vehicles, mixed land use and high-rise buildings all around. The commercial activity of these parts of the city involves unavoidable trips, therefore, the real human population at risk is difficult to quantify. Moreover, there is no recent, authentic pedestrian data available and this study possesses the census figures of the population counted as ‘resident’.
The incidence of noise-borne diseases is very high in high risk areas (HRR). It is recommended that city planners and decision-makers could use geospatial technology to control traffic and land use in such a manner that could limit the noise levels within WHO defined bearable thresholds.
HABITAT FRAGMENTATION Roads can act as barriers or filters to animal movement and lead to habitat fragmentation. Many species will not cross the open space created by a road due to the threat of predation and roads also cause increased animal mortality from traffic. This barrier effect can prevent species from migrating and recolonising areas where the species has gone locally extinct as well as restricting access to seasonally available or widely scattered resources.
CONCLUSION • The linkages between Transport, Environment and Health are well established. • In land transportation, Rail mode is more environment friendly than Road vehicular traffic.