Download
1 / 20
200 likes | 262 Views
HEDAS ANALYSIS STATISTICS (2008-2011) by Altug Aksoy (NOAA/AOML/HRD). HEDAS retrospective/real-time analyses have been performed for the years 2008-2011 Only cases that were Tropical Storm intensity or greater in the Best Track database are considered: 52 total cases

E N D
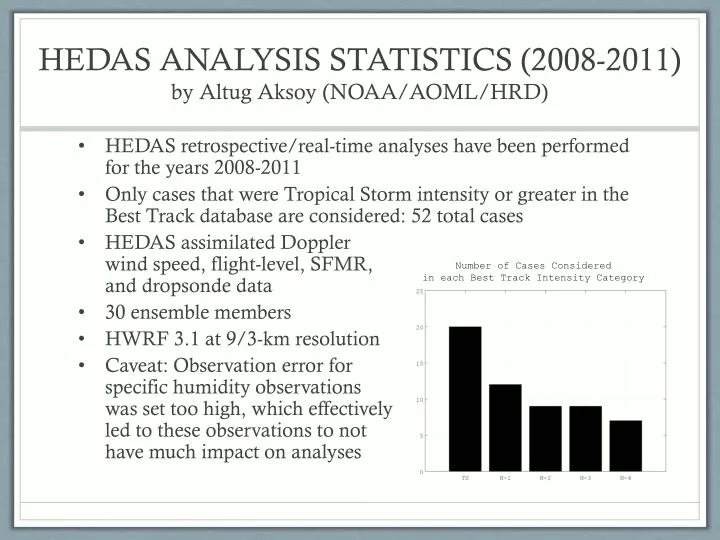
HEDAS ANALYSIS STATISTICS (2008-2011)by Altug Aksoy (NOAA/AOML/HRD) • HEDAS retrospective/real-time analyses have been performed for the years 2008-2011 • Only cases that were Tropical Storm intensity or greater in the Best Track database are considered: 52 total cases • HEDAS assimilated Dopplerwind speed, flight-level, SFMR,and dropsonde data • 30 ensemble members • HWRF 3.1 at 9/3-km resolution • Caveat: Observation error forspecific humidity observationswas set too high, which effectivelyled to these observations to nothave much impact on analyses Number of Cases Considered in each Best Track Intensity Category
POSITION ERROR STATISTICS forHEDAS FINAL MEAN ANALYSIS • Position error is computed with respect to HRD’s high-resolution center fixes database • Position error is computed relative to best track storm motion direction(0° = direction of storm motion) and relative to RMW (r=1 corresponds to 1 RMW) Mean position error andits standard deviation in RMW-relative terms is: Mean error = 0.2 RMW Std. dev = 0.5 RMW Degrees relative to storm motion X = Position error in individual cases RMW-relative distance (r)fromobserved center
INTENSITY ERROR STATISTICS forHEDAS FINAL MEAN ANALYSIS • HEDAS intensity (max. 10-m wind speed and min. sea-level pressure)is plotted against best track intensity for each case HEDAS Intensity (kt) vs. Best Track Intensity (kt) HEDAS MSLP(hPa) vs. Best Track MSLP(hPa) HEDAS intensity explains 84% of variance of Best Track intensity HEDAS MSLP explains97% of variance of Best Track MSLP Best Track Intensity (kt) Best Track MSLP (hPa) Fit between HEDAS and Best Track intensity almost perfect (spread somewhat larger for stronger cases) HEDAS slightly under-estimates MSLP intensity (somewhat worse for weaker cases) TS H-1 H-2 H-3 H-4 HEDAS Intensity (kt) HEDAS MSLP (hPa)
INTENSITY ERROR STATISTICS forHEDAS FINAL MEAN ANALYSIS • HEDAS max. Doppler wind and max. flight-level wind speed is plotted against observed counterparts for each case HEDAS Max. Doppler Wind (m/s) vs. Max. Observed Doppler Wind (m/s) HEDAS Max. F-L Wind Speed (m/s) vs. Max. Observed F-L Wind Speed (m/s) HEDAS max. Doppler Wind explains 98% of variance of observed max. Doppler Wind HEDAS max. F-L wind speed explains82% of variance of max.observed F-L wind speed Max. Observed Doppler Wind Speed (m/s) Max. Observed F-L Wind Speed (m/s) Fit between HEDAS and observed max. Doppler Wind is almost perfect with ~2 m/s HEDAS under-estimation in analysis Fit between HEDAS and observed F-L wind speed is almost perfect TS H-1 H-2 H-3 H-4 HEDAS Max. Doppler Wind Speed (m/s) HEDAS Max. F-L Wind Speed (m/s)
STORM STRUCTURE STATISTICS forHEDAS FINAL MEAN ANALYSIS • HEDAS final mean analyses are compared to corresponding observed airborne radar data for variance explained by the wavenumber components of the azimuthally-averaged tangential wind speed HEDAS Var. Explained by Wavenum-0 for 1-km Vt (%) Vs. Observed (%) HEDAS Var. Explained by Wavenum-1 for 1-km Vt (%) Vs. Observed (%) HEDAS Var. Explained by Wavenum-2 for 1-km Vt (%) Vs. Observed (%) Obs. Wvnum-0 Var. Exp. Of 1-km Vt (%) Obs. Wvnum-1 Var. Exp. Of 1-km Vt (%) Obs. Wvnum-2 Var. Exp. Of 1-km Vt (%) HEDAS Wvnum-0 Var. Exp. Of 1-km Vt (%) HEDAS Wvnum-1 Var. Exp. Of 1-km Vt (%) HEDAS Wvnum-2 Var. Exp. Of 1-km Vt (%) HEDAS capability to explain the variance explained by a wavenumber component of Vt gradually diminishes for higher wavenumbers. Nevertheless, HEDAS generally appears to be within the observed range of values.
STORM COMPOSITE STRUCTURE in HEDAS FINAL MEAN ANALYSIS • HEDAS composite structure of 10-m surface wind is compared to H*Wind– Tropical Storm in Best Track HEDAS Composite 10-m Wind Speed (m/s) H*Wind Composite 10-m Wind Speed(m/s) Degrees relative to storm motion Normalized Radius (xRMW)
STORM COMPOSITE STRUCTURE in HEDAS FINAL MEAN ANALYSIS • HEDAS composite structure of 10-m surface wind is compared to H*Wind– Hurricane Intensity of Cat 1 & 2 in Best Track HEDAS Composite 10-m Wind Speed (m/s) H*Wind Composite 10-m Wind Speed(m/s) Degrees relative to storm motion Normalized Radius (xRMW)
STORM COMPOSITE STRUCTURE in HEDAS FINAL MEAN ANALYSIS • HEDAS composite structure of 10-m surface wind is compared to H*Wind– Major Hurricane in Best Track HEDAS Composite 10-m Wind Speed (m/s) H*Wind Composite 10-m Wind Speed(m/s) Degrees relative to storm motion Normalized Radius (xRMW)
STORM COMPOSITE STRUCTURE in HEDAS FINAL MEAN ANALYSIS • HEDAS composite structure of primary circulation (azimuthally-averaged tangential wind speed) is compared to observed – Hurricane Intensity of Cat 1 & 2 in Best Track HEDAS Composite Tan. Wind Spd (m/s) Observed Composite Tan. Wind Spd (m/s) HEDAS primary circulation structure captures well the observed as obtained from radar data. Mean RMW is within 10 km of observed, and the variability appears to be similar. Height (km) Height (km) Normalized Radius (xRMW) Normalized Radius (xRMW)
STORM COMPOSITE STRUCTURE in HEDAS FINAL MEAN ANALYSIS • HEDAS composite structure of primary circulation (azimuthally-averaged tangential wind speed) is compared to observed – Major Hurricane in Best Track HEDAS Composite Tan. Wind Spd (m/s) Observed Composite Tan. Wind Spd (m/s) HEDAS primary circulation structure captures well the observed as obtained from radar data, however there appears to be a more distinct low bias in HEDAS in stronger cases. RMW is also somewhat over-estimated. Height (km) Height (km) Normalized Radius (xRMW) Normalized Radius (xRMW)
STORM COMPOSITE STRUCTURE in HEDAS FINAL MEAN ANALYSIS • HEDAS composite structure of secondary circulation (azimuthally-averaged radial wind speed) is compared to observed – Hurricane Intensity of Cat 1 & 2 in Best Track HEDAS Composite Tan. Wind Spd (m/s) Observed Composite Tan. Wind Spd (m/s) HEDAS has a harder time to capture the secondary circulation as compared to the observed from radar data. Depth of the inflow layer has distinct positive bias. It is also apparent that the radar data itself is more noisy in its presentation of the secondary circulation, which could be contributing to HEDAS difficulties in producing a realistic analysis of the secondary circulation. Height (km) Height (km) Normalized Radius (xRMW) Normalized Radius (xRMW)
STORM COMPOSITE STRUCTURE in HEDAS FINAL MEAN ANALYSIS • HEDAS composite structure of secondary circulation (azimuthally-averaged radial wind speed) is compared to observed – Major Hurricane in Best Track HEDAS Composite Tan. Wind Spd (m/s) Observed Composite Tan. Wind Spd (m/s) These results are very similar to those for hurricane category 1-2 cases. Height (km) Height (km) Normalized Radius (xRMW) Normalized Radius (xRMW)
COMPOSITE STRUCTURE of SHORT-RANGE ENSEMBLE SPREAD • HEDAS ensemble spread composite structure of 2-km temperature T Ensemble Spread (K, shaded) T Mean (K, contoured) Tropical Storms T Ensemble Spread (K, shaded) T Mean (K, contoured) Hurricanes Cat. 1-2 T Ensemble Spread (K, shaded) T Mean (K, contoured) Major Hurricanes Degrees relative to storm motion Normalized Radius (xRMW)
COMPOSITE STRUCTURE of SHORT-RANGE ENSEMBLE SPREAD • HEDAS ensemble spread composite structure of 2-km specific humidity Log(Q) Ensemble Spread (shaded) Log(Q) Mean (contoured) Tropical Storms Log(Q) Ensemble Spread (shaded) Log(Q) Mean (contoured) Hurricanes Cat. 1-2 Log(Q) Ensemble Spread (shaded) Log(Q) Mean (contoured) Major Hurricanes Degrees relative to storm motion Normalized Radius (xRMW)
COMPOSITE STRUCTURE of SHORT-RANGE ENSEMBLE SPREAD • HEDAS ensemble spread composite structure of 2-km cloud water mix. ratio Log(CWM) Ensemble Spread (shaded) Log(CWM) Mean (contoured) Tropical Storms Log(CWM) Ensemble Spread (shaded) Log(CWM) Mean (contoured) Hurricanes Cat. 1-2 Log(CWM) Ensemble Spread (shaded) Log(CWM) Mean (contoured) Major Hurricanes Degrees relative to storm motion Normalized Radius (xRMW)
COMPOSITE STRUCTURE of SHORT-RANGE ENSEMBLE SPREAD • HEDAS ensemble spread composite structure of 2-km vertical wind speed W Ensemble Spread (shaded, m/s) W Mean (contoured, m/s) Tropical Storms W Ensemble Spread (shaded, m/s) W Mean (contoured, m/s) Hurricanes Cat. 1-2 W Ensemble Spread (shaded) W Mean (contoured, m/s) Major Hurricanes Degrees relative to storm motion Normalized Radius (xRMW)
COMPOSITE STRUCTURE of SHORT-RANGE ENSEMBLE SPREAD • HEDAS ensemble spread composite structure of horizontal wind speed at model level 1 Wspd Ensemble Spread (shaded, m/s) Wspd Mean (contoured, m/s) Tropical Storms WspdEnsemble Spread (shaded, m/s) Wspd Mean (contoured, m/s) Hurricanes Cat. 1-2 WspdEnsemble Spread (shaded) Wspd Mean (contoured, m/s) Major Hurricanes Degrees relative to storm motion Normalized Radius (xRMW)
COMPOSITE STRUCTURE of SHORT-RANGE ENSEMBLE SPREAD • HEDAS ensemble spread composite structure of horizontal wind speed at model level 1 (wavenumber 0 removed) Wspd Ensemble Spread (shaded, m/s) Wspd Mean (contoured, m/s) Tropical Storms WspdEnsemble Spread (shaded, m/s) Wspd Mean (contoured, m/s) Hurricanes Cat. 1-2 WspdEnsemble Spread (shaded) Wspd Mean (contoured, m/s) Major Hurricanes Degrees relative to storm motion Normalized Radius (xRMW)
CONCLUSIONS (1) • A dataset of 2008-2011 cases is obtained with a good distribution of cases across intensity categories (tropical storm to category-4 hurricane) • All cases assimilated airborne Doppler superobs, flight-level and dropsonde observations, and SFMR 10-m wind speed observations • Average position error in the final mean analysis is ~11 km (0.2 RMW) which is comparable to the best track uncertainty (0.1°) – no explicit position information is assimilated • Generally speaking, no bias in HEDAS analysis intensity is observed against Best Track, a small under-estimation occurs in HEDAS MSLP analysis – pressure analysis is indirect, HEDAS does not assimilate pressure information • HEDAS appears to over-estimate intensity compared to H*Wind and maximum observed SFMR data; however much better fit to observed maximum Doppler wind and observed maximum flight-level wind speed data suggests that HEDAS intensity is heavily influenced by the relatively large data volume of Doppler wind observations above surface – surface analysis is indirect through model correlations between higher levels and the surface
CONCLUSIONS (2) • In terms of storm structure, HEDAS captures well the wavenumber 0 and 1 components of the tangential wind, with more difficulties apparent in capturing the wavenumber 2 structure, although HEDAS analyses demonstrate a realistic range of variance explained values for all wavenumbers 0-2 when compared to observed • In a composite sense: • Vertical structure of the primary circulation, compared to radar, is realistic, but the maximum wind speed is under-estimated for stronger storms. • Vertical structure of the secondary circulation is more problematic, with exaggerated inflow depth and under-estimated inflow magnitude; but this could also be partially due to the relatively noisy representation of the secondary circulation by the radar data. • Good agreement of the horizontal 10-m wind speed structure with H*Wind analyses is obtained. • Ensemble spread composites indicate that • Strong signals exist for temperature, cloud water mixing ratio, and vertical wind speed, especially for hurricane cases. • Specific humidity variability is small and does not reveal too much structure. • Horizontal wind speed is strongly impacted by the variability in storm center, which leads to a wavenumber-0-dominant structure.