Download
1 / 55
590 likes | 1.12k Views
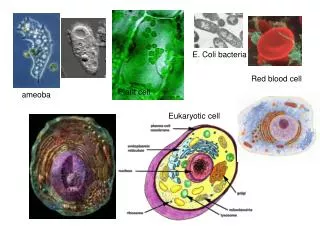
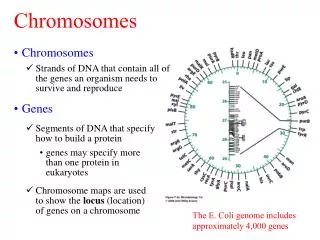
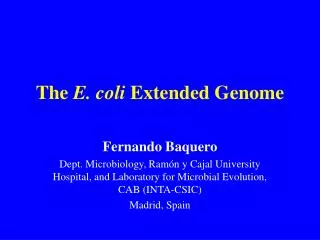
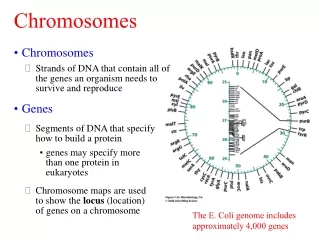
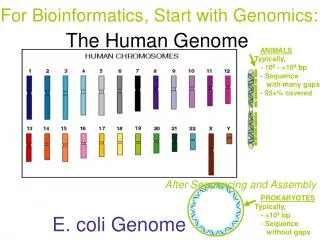
For Bioinformatics. , Start with Genomics:. The Human Genome. ANIMALS Typically, - 10 8 - >10 9 bp - Sequence with many gaps - 95+% covered. After Sequencing and Assembly. PROKARYOTES Typically, - >10 6 bp - Sequence without gaps. E. coli Genome.

E N D
For Bioinformatics , Start with Genomics: The Human Genome ANIMALS Typically, - 108 - >109 bp - Sequence with many gaps - 95+% covered After Sequencing and Assembly PROKARYOTES Typically, - >106 bp - Sequence without gaps E. coli Genome
Who Gets Sequenced? Models Pathogens Agriculturals
Finished Genomes *** * ** * *** ** * ** * * Choanoflaggelate –closest unicellular to animals
Who Gets Sequenced?–Animal model systems: *Vertebrates Homo sapiens Pan troglodytes Mus musculus Rattus rattus Canis familiaris Bos taurus Gallus gallus Xenopus tropicalis + Fufu rubripes Tetraodon nigroviridis Orysias latipes Danio rario **Arthropods 14 Drosophila species Anopholes gambiae + Apis mellifera Ixodes - tick
For Bioinformatics , Start with: Genomics: READING genome sequences ASSEMBLY of the sequence ANNOTATION of the sequence carry out dideoxy sequencing connect seqs. to make whole chromosomes find the genes!
For Bioinformatics , Start with: Genomics: READING genome sequences ASSEMBLY of the sequence ANNOTATION of the sequence carry out dideoxy sequencing connect seqs. to make whole chromosomes find the genes!
2 ways to annotate eukaryotic genomes: -ab initio gene finders: Work on basic biological principles: Open reading frames Consensus splice sites Met start codons ….. -Genes based on previous knowledge….EVIDENCE of message 2 ways to annotate eukaryotic genomes: -ab initio gene finders: -Genes based on previous knowledge….EVIDENCE of message
2 ways to annotate eukaryotic genomes: -ab initio gene finders: Work on basic biological principles: Open reading frames Consensus splice sites Met start codons ….. -Genes based on previous knowledge….EVIDENCE of message cDNA sequence of the gene’s message cDNA of a closely related gene’ message sequence Protein sequence of the known gene Same gene’s Same gene’s from another species Related gene’s protein…….
start and stop site predictions Unique identifiers Splice site predictions Homology based exon predictions computational exon predictions Tracking information Consensus gene structure (both strands)
Automatically generated annotation
A zebrafish hit shows a gene model protein encoded by a 6 exon gene. This gene structure (intron/exon) is seen in other species, as is the protein size. The proteins, if corresponding to MSP in S. gal., must be heavily glycosylated (likely). At least some have a signal peptide.
The zebrafish hit can be viewed down to nucleotide resolution GO LIVE!
Genomics: READING genome sequences ASSEMBLY of the sequence ANNOTATION of the sequence carry out dideoxy sequencing connect seqs. to make whole chromosomes find the genes! But Bioinformatics is more…
End Reads (Mates) Primer SEQUENCE TRANSCRIPTOMICS: cDNAs & ESTs: Expressed Sequence Tags RNA target sample cDNA Library Each cDNA provides sequence from the two ends – two ESTs
Who Gets Sequenced?–Animal model systems: Who Gets EST---- ed?–Animal model systems: ***Millions **100,000s * 10,000s * *Vertebrates Homo sapiens Pan troglodytes Mus musculus Rattus rattus Canis familiaris Bos taurus Gallus gallus Xenopus tropicalis + Fufu rubripes Tetraodon nigroviridis Orysias latipes Danio rario *** *** ** * ** **Arthropods D. melanogaster D. pseudoobscura D. simulans Anopholes gambiae + Apis mellifera * * *
Protein sequence: from peptide sequencing, or from translation of sequenced nucleic acids !!AA_SEQUENCE 1.0 ab025413 peptide tenm4.pep Length: 2771 May 12, 1999 09:34 Type: P Check: 2254 .. 1 MDVKERKPYR SLTRRRDAER RYTSSSADSE EGKGPQKSYS SSETLKAYDQ 51 DARLAYGSRV KDMVPQEAEE FCRTGTNFTL RELGLGEMTP PHGTLYRTDI 101 GLPHCGYSMG ASSDADLEAD TVLSPEHPVR LWGRSTRSGR SSCLSSRANS 151 NLTLTDTEHE NTETDHPSSL QNHPRLRTPP PPLPHAHTPN QHHAASINSL 201 NRGNFTPRSN PSPAPTDHSL SGEPPAGSAQ EPTHAQDNWL LNSNIPLETR 251 NLGKQPFLGT LQDNLIEMDI LSASRHDGAY SDGHFLFKPG GTSPLFCTTS 301 PGYPLTSSTV YSPPPRPLPR STFSRPAFNL KKPSKYCNWK CAALSAILIS 351 ATLVILLAYF VAMHLFGLNW HLQPMEGQMQ MYEITEDTAS SWPVPTDVSL 401 YPSGGTGLET PDRKGKGAAE GKPSSLFPED SFIDSGEIDV GRRASQKIPP
Structural genomics: Coordinates, rather than 1D sequence, Saved
Figure 4.16(1) Microarray Analysis of Those Genes Whose Expression in the Early Xenopus Embryo Is Caused by the Activin-Like Protein Nodal-Related 1 (Xnr1)
Figure 4.16(2) Microarray Analysis of Those Genes Whose Expression in the Early Xenopus Embryo Is Caused by the Activin-Like Protein Nodal-Related 1 (Xnr1)
Figure 4.23(1) Use of Antisense RNA to Examine the Roles of Genes in Development
Figure 4.23(2) Use of Antisense RNA to Examine the Roles of Genes in Development
RNAi for every C. elegans gene too! -results on the web Projects to systematically Knock-out (or pseudo-knockout) every gene, in order to establish phenotype of each gene -> function of each gene
Figure 4.24 Injection of dsRNA for E-Cadherin into the Mouse ZygoteBlocks E-Cadherin Expression
KNOCK-OUTS OF ALL ESSENTIAL GENES – RANDOM MUTAGENESIS ATTEMPT – using transposon mobilization Followed by INVERSE PCR to recover seqeunce adjacent to insertion. Then compare to the complete Drosophila genome sequence to know which ORF “Hit”
About 10% of All Assumed genes “Hit” (~10/100 per interval) on Drosophila X chromosome. 1 series of random insertion experiments.ALL inset sites know, thanks to INVERSE PCR
2-hybrid reaction between one protein and all 6000+ potential interactors in Yeast Genome Figure 1 The two-hybrid assay carried out by screening a protein array. a, The array of 6,000 haploid yeast transformants plated on medium lacking leucine, which allows growth of all transformants. Each transformant expresses one of the yeast ORFs expressed as a fusion to the Gal4 activation domain. b, Two-hybrid positives from a screen of the array with a Gal4 DNA-binding domain fusion of the Pcf11 protein, a component of the pre-mRNA cleavage and polyadenylation factor IA, which also consists of four other polypeptides36. Diploid colonies are shown after two weeks of growth on medium lacking tryptophan, leucine and histidine and supplemented with 3 mM 3-amino-1,2,4-triazole, thus allowing growth only of cells that express the HIS3 two-hybrid reporter gene. Three other components of factor IA, Rna14, Rna15 and Clp1, were identified as Pcf11 interactors. Positives that do not appear in Table 2 were either not reproducible or are false positives that occurred in many screens.
Osprey: integrate all 2-hybrid interactions between all 6000+ proteins in Yeast Genome (Proteome) Figure 2 Visualization of combined, large-scale interaction data sets in yeast. A total of 14,000 physical interactions obtained from the GRID database were represented with the Osprey network visualization system (see http://biodata.mshri.on.ca/grid). Each edge in the graph represents an interaction between nodes, which are coloured according to Gene Ontology (GO) functional annotation. Highly connected complexes within the data set, shown at the perimeter of the central mass, are built from nodes that share at least three interactions within other complex members. The complete graph contains 4,543 nodes of 6,000 proteins encoded by the yeast genome, 12,843 interactions and an average connectivity of 2.82 per node. The 20 highly connected complexes contain 340 genes, 1,835 connections and an average connectivity of 5.39