Download
1 / 17
170 likes | 297 Views
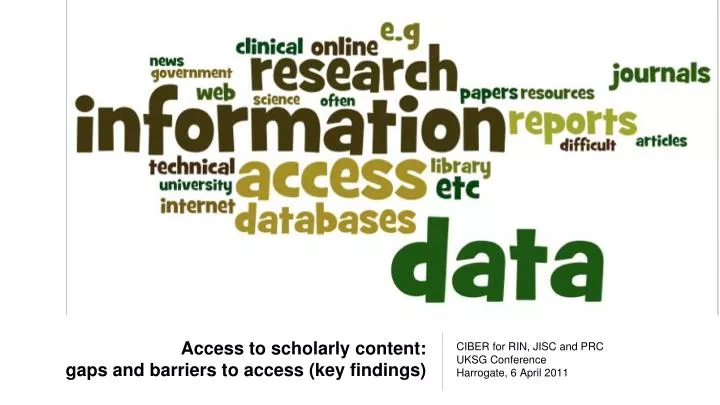
Access to scholarly content: gaps and barriers to access (key findings). CIBER for RIN, JISC and PRC UKSG Conference Harrogate, 6 April 2011. Survey background. Aim and objectives To quantify access gaps and barriers for different communities

E N D
Access to scholarly content:gaps and barriers to access (key findings) • CIBER for RIN, JISC and PRC • UKSG Conference • Harrogate, 6 April 2011
Survey background • Aim and objectives • To quantify access gaps and barriers for different communities • To provide an evidenced assessment of the significance of those gaps and barriers • Survey overview • 2,645 UK completions (12% response rate) • Findings reported by broad sector: • Universities and colleges (47%) • Medical schools and health providers (12%) • Industry and commerce (31%) • Research institutes (10%)
The big pictureUniversities and collegesSurvey breakdown People entering survey 1,000 Any response to Q1 greater than 4, where 1=`Not at all important’ and 7=`Extremely important’ Journal articles are important for 986 Conference papers are important for 771 Responses to Q3 that indicate access is `fairly’ or `very difficult’ Of these 325 are dissatisfied (32.5% of the original population) Of these 68 are dissatisfied (6.8% of the original population) Critical incident response to Q13/Q24 indicates that the respondent has difficulty accessing full text recently Of these 51 report a recent access problem (5.1% of the original population) Of these 219 report a recent access problem (21.9% of the original population) Critical incident response to Q19/Q30 indicates that the respondent failed eventually to get hold of the article … for 171 of whom was not resolved (17.1% of the original population) … for 23 of whom was not resolved (2.3% of the original population)
The survey big pictureIndustry and commerceSurvey breakdown People entering survey 1,000 Any response to Q1 greater than 4, where 1=`Not at all important’ and 7=`Extremely important’ Journal articles are important for 787 Conference papers are important for 600 Responses to Q3 that indicate access is `fairly’ or `very difficult’ Of these 328 are dissatisfied (32.8% of the original population) Of these 234 are dissatisfied (23.4% of the original population) Critical incident response to Q13/Q24 indicates that the respondent has difficulty accessing full text recently Of these 197 report a recent access problem (19.7% of the original population) Of these 123 report a recent access problem (12.3% of the original population) Critical incident response to Q19/Q30 indicates that the respondent failed eventually to get hold of the article … for 144 of whom was not resolved (14.4% of the original population) … for 92 of whom was not resolved (9.2% of the original population)
Current level of access How would you describe your current level of access (in print and online)? Percentages within sector Journal articles n=2,473 Conference papers n=2,522
Perceptions of change How does your current level of access compare with five years ago? Percentages within sector Journal articles n=2,242 Conference papers n=2,019 Note Only respondents who rated journal articles as of some importance are included.
Areas in need of improvementYou said you want to improve access to journal articles. Why?Percentages within sector About this graphic This is a content analysis by CIBER of the respondents’ free text responses to the question.
Coping mechanisms when journal access is a problemUniversities and collegesPercentages of respondents How to read this graphic Respondents were presented with a list of coping mechanisms and could choose as many as applied. Each ray of the spider diagram shows the percentage of respondents who adopted a particular coping mechanism.
Coping mechanisms when journal access is a problemUniversities and collegesPercentages of respondents How to read this graphic Respondents were presented with a list of coping mechanisms and could choose as many as applied. Each ray of the spider diagram shows the percentage of respondents who adopted a particular coping mechanism.
Coping mechanisms when journal access is a problemIndustry and commerce
Coping mechanisms when journal access is a problemIndustry and commerce
The respondents’ own recommendationsWhat would you do to improve the accessibility of journal articles and conference papers?Percentages within sector About this graphic This is a content analysis by CIBER of the respondents’ free text responses to the question.
The respondents’ own recommendationsWhat would you do to improve the accessibility of journal articles and conference papers?Percentages within sector About this graphic This is a content analysis by CIBER of the respondents’ free text responses to the question.