Download
1 / 30
300 likes | 314 Views
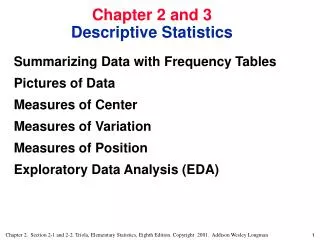
Day 2 Descriptive statistics and data exploration Anne Segonds-Pichon v2019-03. Variable. Quantitative. Qualitative. Continuous. Nominal. Ordinal. Discrete. Ratio. Interval. Quantitative data. They take numerical values (units of measurement) Discrete: obtained by counting

E N D
Day 2Descriptive statistics and data explorationAnne Segonds-Pichonv2019-03
Variable Quantitative Qualitative Continuous Nominal Ordinal Discrete Ratio Interval
Quantitative data • They takenumerical values (units of measurement) • Discrete: obtained by counting • Example: number of students in a class • values vary by finite specific steps • or continuous: obtained by measuring • Example: height of students in a class • any values • They can be described by a series of parameters: • Mean, variance, standard deviation, standard error and confidence interval
Measures of central tendencyMode and Median • Mode: most commonly occurring value in a distribution • Median: value exactly in the middle of an ordered set of numbers
Measures of central tendencyMean • Definition: average of all values in a column • It can be considered as a model because it summaries the data • Example: a group of 5 lecturers: number of friends of each members of the group: 1, 2, 3, 3 and 4 • Mean: (1+2+3+3+4)/5 = 2.6 friends per person • Clearly an hypothetical value • How can we know that it is an accurate model? • Difference between the real data and the model created
Measures of dispersion • Calculate the magnitude of the differences between each data and the mean: • Total error = sum of differences ) = (-1.6)+(-0.6)+(0.4)+(0.4)+(1.4) = 0 No errors ! • Positive and negative: they cancel each other out. From Field, 2000
Sum of Squared errors (SS) • To avoid the problem of the direction of the errors: we square them • Instead of sum of errors: sum of squared errors (SS): = (1.6) 2 + (-0.6)2 + (0.4)2 +(0.4)2 + (1.4)2 = 2.56 + 0.36 + 0.16 + 0.16 +1.96 = 5.20 • SS gives a good measure of the accuracy of the model • But: dependent upon the amount of data: the more data, the higher the SS. • Solution: to divide the SS by the number of observations (N) • As we are interested in measuring the error in the sample to estimate the one in the population we divide the SS by N-1 instead of N and we get the variance (S2) = SS/N-1
Variance and standard deviation • Problem with variance: measure in squared units • For more convenience, the square root of the variance is taken to obtain a measure in the same unit as the original measure: • the standard deviation • S.D. = √(SS/N-1) = √(s2) = s • The standard deviation is a measure of how well the mean represents the data.
Standard deviation Small S.D.: data close to the mean: mean is a good fit of the data Large S.D.: data distant from the mean: mean is not an accurate representation
SD and SEM (SEM = SD/√N) • What are they about? • The SD quantifies how much the values vary from one another: scatter or spread • The SD does not change predictably as you acquire more data. • The SEM quantifies how accurately you know the true mean of the population. • Why? Because it takes into account: SD + sample size • The SEM gets smaller as your sample gets larger • Why? Because the mean of a large sample is likely to be closer to the true mean than is the mean of a small sample.
SD and SEM The SD quantifies the scatter of the data. The SEM quantifies the distribution of the sample means.
SD or SEM ? • If the scatter is caused by biological variability, it is important to show the variation. • Report the SD rather than the SEM. • Better even: show a graph of all data points. • If you are using an in vitro system with no biological variability, the scatter is about experimental imprecision (no biological meaning). • Report the SEM to show how well you have determined the mean.
Confidence interval • Range of values that we can be 95% confident contains the true mean of the population. - So limits of 95% CI: [Mean - 1.96 SEM; Mean + 1.96 SEM] (SEM = SD/√N)
Z-score • Standardisation of normal data with mean µ and standard deviation σ • Example: µ=50 and σ=1. • A variable with value x=60 has a z-score=1
Z-score • Probability that a given value is found in a normally distributed sample with known µ and σ. • Beyond a threshold, values ‘do not belong’ or are very unlikely to be found in such a sample. • Threshold = 1.96 • Normal distribution: 95% of observations lie within μ ± 1.96σ (Z=1.96) • Probability to find values beyond ± 1.96σ is =<5% (p<0.05)
Z-score application RNA-seq analysis • Differential gene expression: Noise • Length of gene and level of expression • Lowly expressed genes = highest fold changes • Often biologically meaningless
Categorical data Data Exploration
Quantitative data: Scatterplot Data Exploration
Quantitative data: Scatterplot/stripchart Data Exploration Small sample Big sample
Quantitative data: Boxplot Data Exploration
Quantitative data: Boxplot orBeanplot Scatterplot shows individual data A bean= a ‘batch’ of data Data Exploration Bimodal Uniform Normal Distributions Data density mirrored by the shape of the polygon
Quantitative data: Boxplot andBeanplotand Scatterplot Data Exploration
Quantitative data: Histogram Data Exploration Big sample Small sample
Quantitative data: Histogram (distribution) Data Exploration
Plotting is not the same thing as exploring • One experiment: change in the variable of interest between CondA to CondB. • Data plotted as a bar chart. The truth The fiction Data Exploration
Plotting (and summarising) is (so) not the same thing as exploring • Five experiments: change in the variable of interest between 3 treatments and a control. • Data plotted as a bar chart. The truth (if you are into bar charts) Comparisons: Treatments vs. Control p=0.001 Exp5 Exp4 p=0.04 Exp3 Data Exploration Exp1 Exp2 p=0.32
Plotting (and summarising and choosing the wrong graph) is (definitely) not the same thing as exploring • Four experiments: Before-After treatment effect on a variable of interest. • Hypothesis: Applying a treatment will decrease the levels of the variable of interest. • Data plotted as a bar chart. The truth Exp2 The fiction Exp1 Exp3 Exp4 Data Exploration