Download
1 / 20
200 likes | 410 Views
Concepts of Variables. Greg C Elvers, Ph.D. Levels of Measurement. When we observe and record a variable, it has characteristics that influence the type of statistical analysis that we can perform on it These characteristics are referred to as the level of measurement of the variable

E N D
Concepts of Variables Greg C Elvers, Ph.D.
Levels of Measurement • When we observe and record a variable, it has characteristics that influence the type of statistical analysis that we can perform on it • These characteristics are referred to as the level of measurement of the variable • The first step in any statistical analysis is to determine the level of measurement; it tells us what statistical tests can and cannot be performed
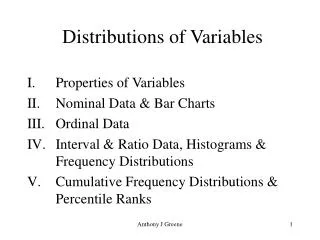
The Four Levels of Measurement • There are four levels of measurement: • Nominal • Ordinal • Interval • Ratio • Each successive level of measurement has all the properties of the lower level of measurement, and more • NOIR = black or dark in French
Nominal Scale • The nominal level of measurement occurs when the observations do not have a meaningful numeric value • e.g. Hair color, whether a person has schizophrenia or not, five digit ZIP codes • Nominal variables classify or categorize the observations into discrete categories • Nominal variables deal with qualitative (and not quantitative) differences
Nominal Variables • The values of nominal variables can be • compared to see if they are equal or not • The values of nominal variables cannot be meaningfully: • compared to see if one is larger than another • added or subtracted • multiplied or divided • Cannot calculate the mean (what most people call the average)
Ordinal Scale • Ordinal variables are used to represent observations that can be categorized and rank ordered • E.g. Class rank, order of finishing a horse race, how much you prefer various vegetables
Ordinal Variables • The values of ordinal variables can be: • compared to see if they are equal or not • compared to see if one is larger or smaller than another • The values of ordinal variables cannot be meaningfully: • added or subtracted • multiplied or divided • Cannot calculate the mean
Interval Scale • Interval variables represent observations that can be categorized, rank ordered, and have an unit of measure • An unit of measure implies that the difference between any two successive values is identical • E.g. Shoe size, IQ scores, o Farenheit • With an interval scaled variable, the value 0 does not represent the complete absence of the variable
Interval Variables • The values of interval variables can be: • compared to see if they are equal or not • compared to see if one is larger or smaller than another • added or subtracted • The values of interval variables cannot be meaningfully: • multiplied or divided • 70oF is not twice as hot as 35oF
Ratio Scale • Ratio variables represent observations that can be categorized, rank ordered, have an unit of measure and have a true zero • The true zero implies that a value of zero represents the complete absence of the variable • E.g. Weight, reaction time, number correct
Ratio Variables • The values of ratio variables can be: • compared to see if they are equal or not • compared to see if one is larger or smaller than another • added or subtracted • multipled or divided
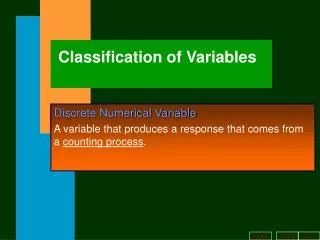
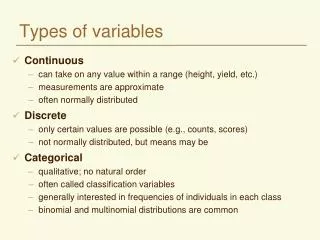
Discrete and Continuous Variables • In addition to the various levels of measure, variables can also be either discrete (or discontinuous) or continuous • A discrete variable can only have values that are whole numbers • E.g. number of children in a family • A continuous variable can have any value • E.g. weight
Variables • Identify four variables, one at each level of measurement • Determine whether each variable is discrete or continuous
Limits of Continuous Variables • Because continuous variables can never be exactly measured, we can never be sure that the value we observed is correct • E.g., when you measure a person’s height, you may only be able to measure to the nearest half inch
Limits of Continuous Variables • A person who was measured as 54.5 inches could actually be anywhere between 54.25 and 54.75 inches tall • If they were less than 54.25 inches tall, their height would have been recorded as 54.0 inches • If they were more than 54.75 inches tall, their height would have been recorded as 55.0 inches
True Limits • The true limits of a continuous variable are the values between which the reported value must fall
Determining True Limits • To determine the true limits: • Determine the unit of measure (how accurately you can measure) • In the above example, the unit of measure in 0.5 inches • The true limits are given by the observed value plus and minus one half of the unit of measure • E.g. 54.5 + (0.5 / 2) = 54.75 and 54.5 - (0.5 / 2) = 54.25
Representing Variables • By convention, in statistical formulae variables are represented by a capitalized letter, usually X or Y • E.g., X might represent how introverted the people in your sample are
Representing Individual Values • When a variable is subscripted (Xi), the subscript implies that you should deal with a particular observation • E.g. X3 might represent how introverted the third person in your sample is
The Summation Operator (S) • Most statistical procedures involve the summation of the values of variables • Rather than to write all the values out (X1 + X2 + X3 + X4 + …) a short hand notation is used: SX