Download

1 / 21
210 likes | 328 Views
Measurement and Estimation of Network QoS among Peer Xbox Game Players. Youngki Lee, KAIST Sharad Agarwal , Microsoft Research Chris Butcher, Bungie Studio Jitu Padhye , Microsoft Research. A series of online multiplayer game via Xbox Live First Person Shooter (FPS) game

E N D
Measurement and Estimation of Network QoS among Peer Xbox Game Players Youngki Lee, KAIST SharadAgarwal, Microsoft Research Chris Butcher, Bungie Studio JituPadhye, Microsoft Research
A series of online multiplayer game via Xbox Live • First Person Shooter (FPS) game • 15 million copies sold worldwide • We focus on Halo 3 for data collection and analysis. • Halo 3 has a large set of widely distributed player population. • released on September 25, 2007.
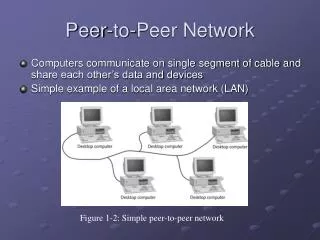
P2P architecture of Halo Xbox console
P2P architecture of Halo • Network QoS between the server peer and other client peers is important for game quality. • excellent experience: latency (< 50ms), BW (50~70Kbps). • minimum requirement: latency (< 150ms), BW (>30Kbps). Xbox Live matchmaking service • P2P, a peer as a server Xbox console
QoS probing among peers Probing using the packet-pair technique Query: Give me a list of hosts that satisfy my criteria Xbox Live matchmaking service Candidate hosts
Motivation • Understand network path quality (NPQ) among peer game players and characteristics of the players • NPQ in terms of network delay and capacity • Address the problem of NPQ measurement overhead • improve user pre-game experience • probe fewer, better candidate hosts • Limited publications on large-scale E2E network characterization • Planetlab-based end-to-end NPQ studies: O(100) nodes • king-based end-to-end NPQ studies O(1000) nodes • several studies of provisioned server based games 6
Methodology • Collect probe data among peer game players • consoles report the probe results back to Xbox live service. • Understand characteristics of peer game playing • Understand NPQ between peer game players • Examine stability and predictability of NPQ • propose three simple predictors • IP history, prefix history, geography • examine robustness of the predictors
Outline • Background • Motivation • Analysis on probe data • general characteristics • NPQ results • NPQ prediction • IP history predictor • prefix history predictor • geography predictor • Conclusion
Data • Session data (per game attempted) • time, session-id, src IP • NPQ measurement data (per probing to a host) • session-id, dest IP • # of packet-pairs sent, # of packet-pairs rcvd • minimum and median latency • average downstream and upstream capacity • Player locations calculated from their IP addresses • MaxMind database provides mapping between locations and IP addresses
Basic statistics • 126 million probes among 5.6million IP addresses !!! 11.14.2007 1.3.2008 (50 days) sessions 39,803,350 5,658,951 distinct IPs 126,085,887 total probes
Geographic distribution 13% in Europe 85% in USA 2% in Asia, Australia
Player characterization • Strong diurnal pattern (peaks between 2 ~ 8PM, UTC time) • Most players played a few games, only some a lot • Probe distribution per game trial (session) • 90% of sessions probed fewer than 10 hosts, but some a lot. 0.9
Delay distribution 25% 0.75 150 • 25% of the delay measurement are above 150ms. • 150 ms: upper bound for responsive experience in FPS games.
Capacity distribution • Peaks around typical broadband capacities in USA. • marginal error due to the packet pair technique.
Outline • Background • Motivation • Analysis on probe data • general characteristics • NPQ results • NPQ prediction • IP history predictor • prefix history predictor • geography predictor • Conclusion
Predictors • Predict NPQ without probing • to disqualify a host, select a host, do quick re-probe • potentially reduce the user-wait time and probe traffic • IP/Prefix history predictor • reuse the previous probe results between the same IP pair • reuse results between two peers within the same prefix pair • determine prefixes by BGP table (12/27/2007RouteViews) • Geography predictor • predict delay or capacity based on the geographic distance
IP history predictor (delay) (50 days) • CV= Stdev/Mean, small CV = small variation • Delays are very consistent over time, even for 50 days • excellent predictor for delay
IP history predictor (capacity) (50 days) • Capacities are also quite consistent over time. • decent predictor for downstream capacity
Prefix history predictor (50 days) • Quite consistent, but more variation compared to IP pairs • outliers mostly caused the variation. • good predictor for delay after removing outliers.
Geography predictor 1200 Delay (ms) 1000 800 600 400 200 0 0 2000 4000 6000 8000 10000 12000 Distance (miles) • Distance has strong correlation with minimum delay • good predictor for removing hosts with high latency
Conclusions • Large-scale end host latency and capacity characterization • Large-scale P2P game network characterization • 126 million probes among 5.6 million unique IPs • NPQ prediction for delay • IP history : great ! • prefix history: good after removing outliers • geography : great for removing distant hosts • NPQ prediction for capacity • IP history: decent! • prefix history: not feasible • geography: not feasible