Download
1 / 20
200 likes | 397 Views
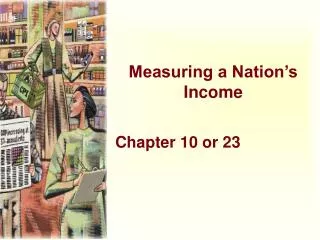
Measuring a Nation’s Income. Chapter 10 or 23. The Economy’s Income and Expenditure. When judging whether the economy is doing well or poorly, it is natural to look at the total income that everyone in the economy is earning.

E N D
Measuring a Nation’s Income Chapter 10 or 23
The Economy’s Income and Expenditure When judging whether the economy is doing well or poorly, it is natural to look at the total income that everyone in the economy is earning. To have this number make sense, it is also best to look at income per person.
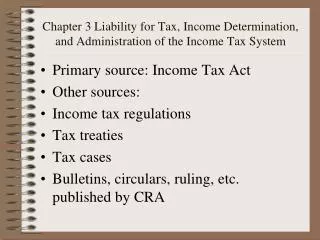
The Economy’s Income and Expenditure • For an economy as a whole, income must equal expenditurebecause: • Every transaction has a buyer and a seller. • Every dollar of spending by some buyer is a dollar of income for some seller. • Say’s Law-Supply creates it’s own demand • This process can be seen using a Circular Flow Diagram.
Gross Domestic Product • Gross domestic product (GDP) is a measure of the income and expenditures of an economy. • It is the total market value of all final goods and services produced within a country in a given period of time. • How much is the current GDP?
Revenue Spending Goods & Services sold Goods & Services bought Inputs for production Labor, land, and capital Wages, rent, and profit Income The Circular-Flow Diagram Market for Goods and Services Firms Households Market for Factors of Production
The Measurement of GDP GDP is: • the market value • of all final goods and services • produced within a country • in a given period of time.
What Is Counted and Not Counted in GDP? GDP includes all items produced in the economy and sold legally in markets. GDP excludes services that are produced and consumed at home and that never enter the marketplace. Caring labor, the work that is normally produced by women. Because GDP does not count it, it diminishes its importance. GDP also excludes black market items, such as illegal drugs.
Other Measures of Income • Gross National Product (GNP) • Net National Product (NNP) • National Income • Personal Income • Disposable Personal Income
The Components of GDP GDP (Y ) is the sum of the following: • Consumption (C) • Investment (I) • Government Purchases (G) • Net Exports (NX) Y = C + I + G + NX
GDP and Its Components (1998) Government Purchases 18% Investment 16% Net Exports -2 % Consumption 68 %
Measuring Economic Growth • We use real GDP to calculate the economic growth rate. • The economic growth rate is the percentage change in the quantity of goods and services produced from one year to the next. • We measure economic growth so we can make: • Economic welfare comparisons • International welfare comparisons • Business cycle forecasts
Measuring Economic Growth • Business Cycle Forecasts • Real GDP is used to measure business cycle fluctuations. • These fluctuations are probably accurately timed but the changes in real GDP probably overstate the changes in total production and people’s welfare caused by business cycles.
Real versus Nominal GDP • Nominal GDP values the production of goods and services at current prices. • Real GDP values the production of goods and services at constant prices.
Real GDP and the Price Level • Deflating the GDP Balloon • Nominal GDP increases because production—real GDP– increases.
Real GDP and the Price Level • Nominal GDP also increases because prices rise. • Deflating the GDP Balloon
Real GDP and the Price Level • We use the GDP Deflator to take the air out of Nominal GDP.
(Periods of falling real GDP) Real GDP in the United States Billions of 1992 Dollars 8,000 7,000 6,000 5,000 4,000 3,000 1970 1975 1980 1985 1990 1995 2000
Hawaii GSP (1997) • This pie chart shows how Hawaii’s Gross State Product is broken down. • Notice how the visitor industry is relatively high (21%). • Refer to Time Series of Hawaii GSP. • Refer to comparison of USA and Hawaii GDP and GSP.