3 Phases
3 Phases. Phase 1 – Desk based exercise Phase 2 – Monitoring the pilot study Phase 3 – Evaluation of the pilot. Phase 1 – stage 1. Review approaches to fare setting for public service ferries in other countries, including the RET approach. Phase 1 – stage 2.

3 Phases
E N D
Presentation Transcript
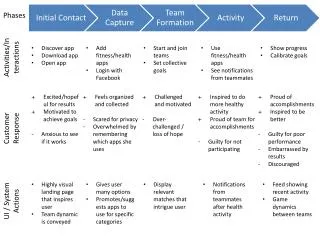
3 Phases • Phase 1 – Desk based exercise • Phase 2 – Monitoring the pilot study • Phase 3 – Evaluation of the pilot
Phase 1 – stage 1 • Review approaches to fare setting for public service ferries in other countries, including the RET approach
Phase 1 – stage 2 • Offer definitions of RET that could be applied to all categories of passenger and vehicular traffic in the context of ferry fares for the Clyde and Hebrides and Northern Isles routes which are subsidised by the Scottish Government
Phase 1 - stage 3 • Provide an initial analysis of the potential impacts (especially in economic and social terms) of the introduction of the RET approach
Phase 1 – stage 4 • Make recommendations on the design and implementation of a pilot study applying RET probably on one or more of the routes connecting the Scottish mainland and the Western Isles, including the choice of route(s), anticipated costs, start date, length of the pilot, operational constraints and any capacity constraints that may emerge
Phase 1 – stage 5 • Carry out any baseline information gathering in advance of the pilot that is considered necessary for subsequent monitoring and evaluation purposes
Scottish Ferry Network • Clyde and Hebrides Ferry services – serves 22 islands and 4 peninsulas on Scotland’s west coast • Caledonian MacBrayne has recently undergone a restructuring • For the first time CHFS was put out to tender • Fare levels are a consequence of historical reasons and tend to increase in line with inflation • Fares for cars range from £17.70 for the Colintraive – Rhubodach route to £201.10 on the Oban – Castlebay/Lochboisdale route • Fares per mile for cars range from £14.42 on the Colintraive to Rhubodach route to £1.12 per mile on the Oban to Castlebay/Lochboisdale route
Scottish Ferry Network • Northlink Ferries Limited operate ferry services between the Scottish mainland to and from Orkney and Shetland • Similarly to CHFS the services are tendered to comply with European legislation • Fare levels are set in the tender specification and have been arrived at through historical reasons – from commercial fares set by P & O, through to today’s Public Service Contract • Fares for cars range from £120.80 on the Scrabster – Stromness route to £291.20 on the Aberdeen – Lerwick route • Fares per mile for cars range from £0.66 on Aberdeen - Lerwick to £2.02 on the Scrabster – Stromness route.
Denmark • The Danish National Rail Authority is the regulating body for rail and ferry services in Denmark. • There are a variety of internal ferry services: • The majority attract some degree of subsidy from national, regional or local Government. • Some are also provided on a purely commercial basis. • There are 54 routes varying from 0.06 miles to 106 miles in length. • The responsible body determines a maximum acceptable fare for a route under consideration and the performance of the route is examined to determine if a subsidy is required. • The maximum acceptable fare is based on historic fares combined with political motives; initiatives such as promoting regional development and changes to operating costs.
Denmark • On lifeline routes resident islanders do not pay a passenger fare to use the ferry or to transport a bicycle or to take a car if they are registered disabled. • Many of the subsidised routes are considered “socially substantiated” or lifeline services and regulated by national or local government. • All of the routes which are subsidised are tendered services. • In many cases services are tendered by the same organisation which ultimately operates the service. • Similar to Scotland, there is an inverse correlation between route distance and fare/mile but on shorter routes fares are lower than in Scotland: • The fare per mile on the Danish network for cars is similar to Scotland and varies by route, ranging from £0.32/mile up to £19. 60/mile on tendered routes. • Total fares for commercial vehicles can be as high as £96.6/mile compared to £40.25/mile in Scotland.
Sweden • There are three different types of ferry operation in Sweden. • Services to Gotland – operated by a private shipping company under a Public Service Contract. The Swedish Government meets any shortfall between revenue and operating costs and also sets the timetable and fare levels. • Small road ferries – a network of 38 services operate across rivers and estuaries to provide a service to connect a network of roads rather than bridges. All services are operated by Farjerederiet, an organisation of the Public Roads Department of Sweden, 37 of the 38 routes are free of charge with costs off-set by general taxation. • Coastal vessels – commercial coastal shipping routes which are privately operated and considered fully commercial in nature.
Sweden • Ferry services have become a part of the road network • Principle in Swedish roads legislation that roads should be taken care of on a national basis if the road is required for “common purpose” • Small road ferries are therefore free of charge
Norway • There are 124 ferry routes in Norway which vary in length from 0.4 miles to 70 miles. The routes are operated by 18 different companies and, with the exception of three, are all privately owned. • There are three classifications of ferries: • The Hurtigruten Coastal Ferry – the coastal ferry between Bergen and Kirkenes. • Fast ferries – designed as “commuter ferries” which are only capable of taking passengers and light freight. • Car ferries – integral part of the road network within Norway and used to cross fjords and provide access to the many islands off the mainland. • All ferry services are tendered as “bundles” which are geographically based and contain both profitable and unprofitable routes. Ferry companies are required to sign a contract outlining the frequency, fares and minimum level of service for a licensing period of 10 years.
Norway • The national pricing structure for every ferry company consists of the following: • The length of the connection; • The cost of the alternative road route vehicles would have taken if there were no ferry (if applicable); and • The length of the vehicle. • The fare levels for routes of similar length can vary significantly. • The fares reflect the political decision that it should not cost more to travel by ferries than it costs to drive to the destination by car. • In most cases the revenues from the ferry fares do not cover the cost of their operation so subsidies are essential.
Norway • The Norwegian Government are currently researching alternatives to the existing fare structure: • One pilot has been carried out to trial a free ferry service based on the Swedish principles. • The introduction of on and off-peak fares are also being investigated as a means of managing capacity issues. • In both Scotland and Norway the fares per mile are higher for shorter routes, although in Scotland the fares on short crossings are much higher than routes of similar length in Norway. • For the majority of routes of similar distance the fares in Norway are lower in comparison to Scotland, ranging from £0.69 per mile to £7.00 per mile for cars. • Fares for commercial vehicles range from £1.77 per mile to £44.70 per mile.
Canada • There are a large number of private sector ferry operators in Canada providing subsidised services on behalf of the government. • Of particular interest to this study are the 7 services operated in Newfoundland and Labrador. • The Government of Newfoundland and Labrador is responsible for the management of ferry operations. They are also responsible for the operation of some services while other routes are tendered. • In 2006 a system of RET was introduced on ferries • Since 2006 fares are now set with reference to the Canadian Automobile Association Set Cost of Driving. • Fares are calculated using fixed and variable costs for a medium sized vehicle in line with changing fuel prices. This figure is then applied to the distance of the route to calculate the fare.
Canada • The introduction of this RET based approach resulted only in a decrease in fares, where an increase in price would have arisen there was no change to the particular fare: • Vehicle rates are 101.27 cents (£0.56) per mile in all cases. Any case where this varies is due to the fact that no fares were allowed to increase above the previous years rate. • Passenger rates have been set to 1/3 of RET in the new rate schedule. • A review to consider the application of this approach to fares for heavy goods and commercial vehicles is to be undertaken in due course.
Ireland • There are currently 16 subsidised ferry services in Ireland, ranging from 1 to 25 miles in length. • The services are provided by 15 different operators. • Tenders are awarded for individual services, with the exception of the Aran Islands where the three services are tendered as a “bundle”. • The contract for the provision of a service usually specifies the minimum number of sailings and the maximum return passenger fare which may be charged to islanders – currently €8 (£5.40) per passenger . Many operators charge less than this and the Government reimburses the operator the difference between the standard and discounted fare charged. • Similar to Scotland, car fares are higher for shorter routes and range from £6.10 per mile to £12.50 per mile for relatively short crossings.
Spain • In Spain there are three “bundles” of services which are defined as being services of “Public Interest” and link the Spanish mainland to the: • Balearic Islands; • Canary Islands; and • Spanish cities of Ceuta and Melilla in North Africa. • There are 22 routes in total which range in distance from 19 to 534 miles. • Services are either provided by: • Public Service Lines – operators are free to decide on the schedule; capacity; route and fares which permit a commercial operation. There is a requirement for reduced fares to be offered to islanders with the shortfall off-set by Government subsidy. • Public Interest Service Contracts – awarded by tender for a 5 year period and subject to an agreed specification in terms of route; fares; forecast demand and Government subsidy. • Fares for cars range from £0.97 per mile up to £8.67 per mile on the shortest route.
Germany • There is a requirement for services to be provided to the islands all year round. • There are 15 services in total, ranging from 2 miles to 26 miles in length. • Most of the services are passenger only. • Fares are higher per mile for routes of similar length in Scotland. • Fare for cars range from £2.47 per mile to £9.41 per mile.
New Zealand • Ferry services in New Zealand are provided by commercial operators on a mix of tendered and commercially viable routes. • Some internal ferry services are considered an essential element of the public transport network and receive operational or financial support. These services are generally put out to tender. The fares are set by the relevant public authority on the basis of the existing fare schedule which relates to the journey distance. • On commercially viable routes operators generally determine the fares they expect the market to accommodate and apply for top up funding where the revenue collected is insufficient. • Fare levels for cars are around £9.00 per mile
Ferry Fares Comparison Highest Fare per mile (car)
Ferry Fares Comparison Lowest Fare per mile (car)
Phase 1 – Stage 2 • Offer definitions of RET that could be applied to all categories of passenger and vehicular traffic in the context of ferry fares for the Clyde and Hebrides and Northern Isles which are subsidised by the Scottish Government
Factors Influencing Vehicle Running Costs • Size of the engine • Depreciation • The age of the vehicle • Fuel efficiency • The weight or size of the vehicle • The cost of fuel • Petrol or diesel • Mileage
Her Majesty’s Revenue and Customs Approved Mileage Allowance Payments
RAC – Factors included in running costs • Engine size • Fuel consumption • Depreciation • Financing charges • Fuel cost • Servicing and maintenance • Tyres and replacement parts • Insurance premium
RAC RAC Estimated Vehicle Running Costs – Petrol Engines
AA AA Estimated Vehicle Running Costs (in pence) – Petrol Engine per mile
Road Haulage Association (RHA) RHA – Estimated commercial vehicle running costs (in pence) per mile
Freight Transport Association (FTA) FTA - Estimated commercial vehicle running costs (in pence) per mile * Costs per mile are for a selection of commercial vehicle types
First Scotrail First Scotrail – Estimated passenger cost per mile (£)
Citylink Citylink Buses – Estimated passenger cost per mile (£)
CalMac CalMac - Estimated passenger cost per mile (£)
Phase 1 – Stage 2 • Offer definitions of RET that could be applied to all categories of passenger and vehicular traffic in the context of ferry fares for the Clyde and Hebrides and Northern Isles which are subsidised by the Scottish Government
Phase 1 – Stage 3 • Provide an initial analysis of the potential impacts (especially in economic and social terms) of the introduction of the RET approach
Phase 1 – Stage 4 • Make recommendations on the design and implementation of a pilot study applying RET probably on one or more of the routes connecting the Scottish mainland and the Western Isles, including the choice of route(s), anticipated costs, start date, length of the pilot, operational constraints and any capacity constraints that may emerge
Phase 1 – Stage 5 • Carry out any baseline information gathering in advance of the pilot that is considered necessary for subsequent monitoring and evaluation purposes
Phase 2 • Will involve the monitoring of the pilot study • Gathering of traffic statistics and information • Consultation with ferry users and local employers, including freight and tourist sectors • Designed to allow the impact of the pilot to be assessed – especially in economic and social terms
Phase 3 • Involve an evaluation of the pilot • Making use of the information gathered through the baseline and monitoring exercise • Quantify the costs and benefits which could arise should RET be applied on a permanent basis and rolled out across the CHFS and Northern Isles networks • Identify any capacity constraints that may emerge from a permanent roll out • Quantify the costs of increasing the capacity to meet demand through additional or larger vessels, and new shore infrastructure
RET Presentation • Open Discussion