Download
1 / 22
220 likes | 385 Views
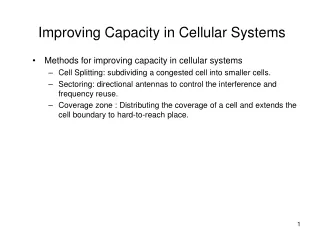
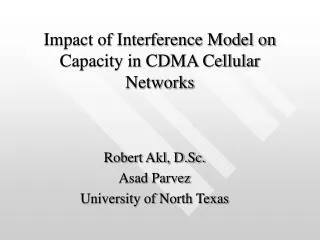
Impact of Interference Model on Capacity in CDMA Cellular Networks. Robert Akl, D.Sc. Asad Parvez University of North Texas. Outline. Introduction to CDMA networks Average interference model Actual interference model Optimized capacity 2D Gaussian user model Conclusions. FDMA. TDMA.

E N D
Impact of Interference Model on Capacity in CDMA Cellular Networks Robert Akl, D.Sc. Asad Parvez University of North Texas
Outline • Introduction to CDMA networks • Average interference model • Actual interference model • Optimized capacity • 2D Gaussian user model • Conclusions
FDMA TDMA CDMA Frequency Call 1 Call 4 Call 2 Call 3 Frequency Call 4 Frequency Call 3 Call 2 Time Call 1 Call 10 Call 7 Call 1 Call 4 Call 11 Call 5 Call 8 Call 2 Call 12 Call 6 Call 3 Call 9 Code Time Time Code Division Multiple Access (CDMA) Overview • Multiple access schemes
Spread Spectrum: Direct Spreading 1 chip period Data Signal 1 bit period Data Signal Interference PN-code Spreading Coded Data Signal PN-code Recovered Data Signal De-spreading Decoded data Signal
Factors Affecting Capacity • Power Control Pt1: Power transmitted from c1 Pt2: Power transmitted from c2 Pr1: Power received at base station from c1 Pr2: Power received at base station from c2 Pr1 = Pr2 c2 Pt2 Pr2 Base Station Pt1 Pr1 c1 d2 d1 Distance
Factors Affecting Capacity (cont.) • Soft handover of calls Time
Factors Affecting Capacity (cont.) • Universal frequency use • Reverse link vs forward link • Voice activity factor E A F D A A A A A A A A G C A A A B TDMA or FDMA CDMA Forward link Reverse link
Relative Average Inter-cell Interference Model Cell i Relative average interference at cell i caused by nj users in cell j A Cell j B Back
Interference Matrix Hence, the total relative average inter-cell interference experienced by cell i is C
Relative Actual Inter-cell Interference Model • Interference matrix F cannot be calculated in advance • Instead, a new interference matrix U is computed as follows • For a user k in cell j, the relative actual interference offered by this user to cell i is D • Hence, the total relative actual inter-cell interference at cell i caused by every user in the network is k users in cell j E
Actual Interference Matrix U • Example: for a new call in cell 2, compute row matrix U[2,i] for i = 1,…,M using equation D • Update 2nd row of interference matrix U by adding the above row matrix to it.
Capacity • The capacity of a CDMA network is determined by maintaining a lower bound on the bit energy to interference density ratio, given by • W = Spread signal bandwidth • R = bits/sec (information rate) • α = voice activity factor • ni = users in cell i • N0 = background noise spectral density F • Let τ be that threshold above which the bit error rate must be maintained, then by rewriting Eq. F G Back
Capacity Cases • Equal capacity: all cells have an equal number of users • Optimized Capacity: A set of users in each cell obtained by solving following optimization problem H
Simulations • Network configuration • COST-231 propagation model • Carrier frequency = 1800 MHz • Average base station height = 30 meters • Average mobile height = 1.5 meters • Path loss coefficient, m = 4 • Shadow fading standard deviation, σs = 6 dB • Processing gain, W/R = 21.1 dB • Bit energy to interference ratio threshold, τ = 9.2 dB • Interference to background noise ratio, I0/N0 = 10 dB • Voice activity factor, α = 0.375 • These values in Eq. G give upper bound on the relative interference in every cell, c_eff = 38.25.
Average interference Users in each cell: 18 Actual interference Users in each cell: 17 Simulations – Equal Capacity
Simulations – Optimized Capacity Vs Actual Interference Capacity • Optimized Capacity using average interference = 559 • Simulated Capacity using actual interference = 554
More Simulations – Actual Interference • Simulated Capacity = 568 • Simulated Capacity = 564
Individual Cell Capacity Comparison • Comparison of cell capacity for 3 simulation trials. • Comparison of average cell capacity for 50 simulation trials.
Extreme Cases Using Actual Interference – Non-Uniform Distribution • Maximum network capacity of 1026 with best case non-uniform user distribution • Maximum network capacity of 108 with worst case non-uniform user distribution
Model User Distribution by 2D Gaussian • Mean = 0 and standard deviation = 200 • Mean = 0 and standard deviation = 500
Model User Distribution by 2D Gaussian • Mean = 0 and standard deviation = 900 • Non-zero mean, standard deviation between 100-300
Conclusions • Actual interference model is computationally intensive. • Capacity obtained using average interference is close to the capacity obtained using actual interference for uniform user distribution. • Average interference model cannot predict extreme variations in network capacity under non-uniform user distribution. • Can use 2D Gaussian distribution to model uniform and non-uniform user distribution.