Download
1 / 20
200 likes | 227 Views
This presentation by Daniel Lennartsson discusses the turnover survey in the services sector, including demands from users, survey methods, VAT legislation, and the aim of the project.

E N D
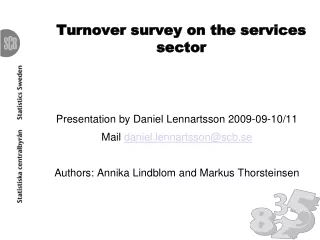
Turnover survey on the services sector Presentation by Daniel Lennartsson 2009-09-10/11 Mail daniel.lennartsson@scb.se Authors: Annika Lindblom and Markus Thorsteinsen
Disposition • Demands from users • Method until 2007 • Surveydesign today • VAT legislation • Aim of this project • Is it possible to use VAT data • First study concerning first quarter 2009
2. Survey method on Other services until 2007 The Swedish parliament approved a change in return period from month to quarter, in force from January 2008 in the VAT data Demands from users changed from January 2008 from quarterly to monthly Until 2008 we used a mixture of: • administrative data (VAT) from the Swedish Tax Authority – used for all small enterprises • Current Ratio Method used for imputation • data collected from questionnaires – used for all large enterprises • a few NACE acitivties were based only on questionnaires
2. Effects of the new regulation • Due to effect of the change demands from users it was hard to use VAT data before it was investigated • Due to timeliness VAT data for small enterprises is complicated to use in the survey on Other services • The change in return period for small enterprises meant that Stat Sweden was forced to collect the information direct from enterprises • Response burden increased
3. Surveydesign today Other services: • Monthly survey to approx 4 500 enterprises each month. Results Total service production and six aggregates. T+35 - Quarterly suvey to additional 5 500 enterprise. Monthly information collected. Results for 88 activities. T+45
4. VAT- Change in the legislation The Swedish Parliament approved a change in return period from month to quarter, in force from first January 2008, regarding small enterprises. Enterprises with an estimated annual turnover: • exceeding 40 million SEK are, as before, required to report VAT on a monthly basis • below or equal to 40 million SEK are required to report VAT on a quarterly basis
4. Time points for submission of the VAT-return • The VAT-return for a large monthly enterprise must be submitted at the latest about 25 days after the end of the reference month • The VAT-return for a small quarterly enterprise must be submitted at the latest about 40 days after the end of the reference quarter • Statistics Sweden need the VAT-data about 35 days after the end of the reference quarter
5. Aim of this project Statistics Sweden approach is to: • use a sample survey (and collect information direct from the enterprises) for a monthly indicator • explore the possibility to use VAT-data for small enterprises in the production of the detailed quarterly estimates Study different methods to use observed values in the VAT-data to compensate for enterprises not submitted the VAT return, due to timeliness.
6. Proportion of turnover that has been reported within 38 days after the expiredate of the reference period
7. Study concerning the first quarter year 2009 The objective of the study was to evaluate differences between estimates based only on observed VAT-data and estimates based on VAT-data where imputation has been used for a number of enterprises due to timeliness. • VAT-data on all four quarters year 2008 can be observed • At this time point, VAT-data for all enterprises regarding the first quarter year 2009 can be observed
7. Timeliness for enterprises reporting monthly and need for imputation • Due to timeliness the third month often is missing in the VAT-data for a specific quarter (about 80% of the monthly enterprises) • To produce quarterly estimates using VAT- data values for the third month has to be imputed for the majority of the small monthly enterprises • Current Ratio Imputation (by industry)
7. Current Ratio imputation The current ratio imputation works as follows: The imputed turnover value for enterprise k month three: enterprise k:s turnover value month one enterprise k:s turnover value month two enterprise k:s turnover value month three
7. Timeliness for enterprises reporting quarterly and need for imputation • Due to timeliness values for the specific quarter often is missing in the VAT-data (about 82% of the quarterly enterprises) • Two imputation methods were used: -Current Ratio Imputation (by industry) -Imputation by average in strata (based on industry and size)
7. Imputation of quarterly enterprises • The monthly enterprises imputed by CR are regarded as observed values when the quarterly enterprises is CR or AV imputed • For enterprises with an observed value Q1 2009 , use VAT-data for all four quarters year 2008 in the CR imputation • Impute missing quarterly enterprises with the turnover average in stratum, based on observed and imputed values for monthly enterprises Q1 2009
7. Observed values vs imputed values by CR imputation and imputation by average in strata, AV