Download
1 / 21
210 likes | 367 Views
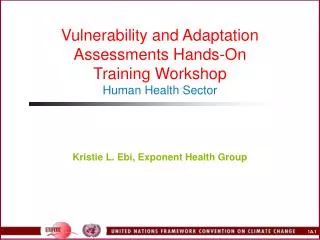
Vulnerability and Adaptation Assessments Hands-On Training Workshop Human Health Sector. Kristie L. Ebi, Exponent Health Group. Outline. Qualitative example WHO Inter-R egional Workshop on Health Impacts from Climate Variability and Change in the Hindu Kush- Himalayan Region

E N D
Vulnerability and Adaptation Assessments Hands-On Training WorkshopHuman Health Sector Kristie L. Ebi, Exponent Health Group
Outline Qualitative example WHO Inter-Regional Workshop on Health Impacts from Climate Variability and Change in the Hindu Kush-Himalayan Region Mukteshwar, India 3-7 October 2005 Quantitative example WHO Global Burden of Disease Sudan Initial National Communication
Steps in Assessing Vulnerability and Adaptation • Describe the current distribution and burden of climate-sensitive diseases • Describe the association between climate and disease outcomes • Identify and describe current strategies, policies, and measures to reduce that burden • Review the health implications of the potential impact of climate variability and change on other sectors • Estimate future potential health impacts using scenarios of climate change • Identify additional adaptation measures to reduce potential negative health effects
Climate-Sensitive Health Outcomes Mountain Regions • Heatwaves • Flood deaths/morbidity • Glacial lake floods • Flash • Riverine (plain) • Vector-borne disease • Malaria • Japanese Encephalitis • Kala-azar • Filariasis • Dengue • Water-borne diseases • Water scarcity, quality • Drought-related food insecurity
Current Burden of Disease in Bhutan • Flood deaths/morbidity • Glacial lake floods 3 • Flash 3 • Vector-borne disease • Malaria 1 • Kala-azar 1 • Filariasis 1 • Water-borne diseases 2 • Water scarcity, quality 2 • Drought-related food insecurity 1
Particularly Vulnerable Populations • Glacial lake floods: Elderly, poor, nomadic, children, disabled or infirm, women, independently living ethnic groups in remote areas • Flash: Everyone in the path of the floods • Riverine (plains): Elderly, poor, nomadic, children, the disabled or sick, women, and people in poor housing, coastal areas, institutions, or on isolated islands
Steps in Assessing Vulnerability and Adaptation • Describe the current distribution and burden of climate-sensitive diseases • Describe the association between climate and disease outcomes • Identify and describe current strategies, policies, and measures to reduce that burden • Review the health implications of the potential impact of climate variability and change on other sectors • Estimate future potential health impacts using scenarios of climate change • Identify additional adaptation measures to reduce potential negative health effects
Adaptation Options • Climate-sensitive diseases are a problem today with programs in place to try to reduce their burden • Current programs will need to be revised and augmented to cope with climate change-related risks • New programs may be needed to address changes in the geographic range of some vector-borne diseases
WHO Global Burden of Disease Approach McMichael AJ, Campbell-Lendrum D, Kovats S, Edwards S, Wilkinson P, Wilson T, et al. 2004 Global Climate Change. In: Comparative Quantification of Health Risks: Global and Regional Burden of Disease due to Selected Risk Factors. Eds. Ezzati M, Lopez A, Rodgers A, Murray C. P 1543-1649. WHO, Geneva
Data Sources • WHO World Health Report • Chapter 20 of the Global Burden of Disease Study • Output from MAGICC-SenGen
WHO World Health Report Annexes • Basic indicators for all WHO member states • Deaths by cause, gender, and mortality stratum for WHO regions • DALYs • Healthy life expectancy • National level indicators • National health accounts • Millennium Development Goals
WHO South-East Asia Region • B = countries with low child and low adult mortality • Indonesia, Sri Lanka, Thailand • D = countries with high child and high adult mortality • Bangladesh, Bhutan, Democratic People’s Republic of Korea, India, Maldives, Myanmar, Nepal, Timor-Leste
Diseases Included in WHR • Diarrheal diseases • In 2002, worldwide there were 1,798,000 deaths or 3.2% of all deaths • Burden in SEAR-B was 41,000 deaths • Burden in SEAR-D was 563,000 deaths • Malaria • Schistosomiasis • Dengue • Protein-calorie malnutrition
GBD Health Outcomes Considered McMichael et al., 2004
WHO Global Burden of Disease Exposure-Response Relationships • 5% increase in diarrheal incidence per degree C increase in temperature • Central, low, and high relative risks estimated relative to baseline climate • For example, for 2030, the central estimate for unmitigated emissions for SEAR-B was 1.00 and for SEAR-D was 1.09
Calculating Potential Future Disease Burdens Using • Baseline burden of disease • Relative risk increase per temperature change • Output from MAGICC-SenGen • Estimate qualitatively how much adaptation could decrease disease burden
Sudan National Communication • Using an Excel spreadsheet, modeled malaria based on relationships described in MIASMA • Calculated monthly changes in transmission potential for the Kordofan Region for the years 2030-2060, relative to the period 1961-1990 using the IPCC IS92A scenario, simulation results of HADCM2, GFDL, and BMRC, and MAGICC/SCENGEN
Sudan – Projected Increase in Transmission Potential of Malaria in 2030
Sudan – Projected Increase in Transmission Potential of Malaria in 2060
Sudan – Malaria Projections • Malaria in Kordofan Region could increase significantly during the winter months in the absence of effective adaptation measures • The transmission potential during these months is 75% higher than without climate change • Under HADCM2, the transmission potential in 2060 is more than double baseline • Transmission potential is projected to decrease during May-August due to increased temperature