Download
1 / 25
250 likes | 336 Views
Explore longitudinal data on gross job flows at state level, identifying trends pre & post-recession and analyzing job growth impacts. Discover insights into regional variations and the influence of larger states on national statistics. Understand the significance of gross job gains and losses in economic establishments.

E N D
U. S. Bureau of Labor Statistics Business Employment Dynamics: State Gross Flows Eric Simants and David M. Talan International Conference on Establishment Surveys Montreal, QC 21 June 2007 The views expressed here are those of the authors and do not necessarily reflect the official policy of the U.S. Bureau of Labor Statistics.
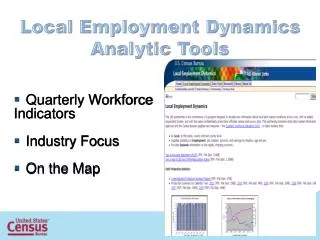
Overview • Business Employment Dynamics (BED) • State-level BED time series data • Recession • Recovery • Gross Job Gains and Gross Job Losses and its impact on Job Growth
What is Business Employment Dynamics? • Longitudinal data series constructed from quarterly cross-sectional data • Analyzes quarterly gross job flows • Unit of analysis is the Establishment • An establishment is defined as an economic unit, typically located at a unique physical site and engaged in predominately one type of production activity
BED Data Elements • Gross job gains • Sum of job gains at Expanding and Opening establishments • Gross job losses • Sum of job losses at Contracting and Closing establishments
State-level BEDTime Series Data • Data reveal some states began downturn in job growth about one year prior to the recession • Jobless recovery is evident for most states 6 quarters into the recovery • Job growth occurring in most states since 2003Q3 • Are more establishments expanding or opening, or are less establishments contracting or closing?
Recession • 2001Q1 shows the first time in the national-level BED time series where gross job losses greater than gross job gains • 21 states had gross job losses in excess to gross job gains in 2000Q3 • Declining trends for gross job gains coupled with increasing trends for gross job losses in most states may have been masked in national-level time series data
Influence of larger stateson national BED time series • Four largest states in regards to total employment (California, Texas, New York and Florida) comprise nearly 1/3 of total gross job gains and gross job losses nationally • Gross job gains well above gross job losses in these 4 states until 2001Q1
Influence of larger stateson national BED time series • CA, TX, NY, FL combined 2000Q3 data • Gross job gains = 2,804,989 • Gross job losses = 2,553,053 • Difference = 251,936 • National 2003Q3 data • Gross job gains = 8,724,000 • Gross job losses = 8,578,000 • Difference = 146,000
Peak of Gross Job Losses • Gross job losses peak at over 9.1 million for the entire nation in 2001Q3 • 8 states (Arizona, Colorado, Florida, Georgia, Hawaii, Nevada, Texas and Utah) do not peak until 2001Q4 • Result of backlash from Sept 11th tragedies or consumers tightening spending?
Great Lake States • 5 (IL, IN, MI, OH and WI) states have gross job losses greater than gross job gains in 2000Q3 – NY and PA only 2 that didn’t • Began showing negative job growth 2 quarters prior to national data • 3 (IN, MI, WI) have gross job losses greater than gross job gains 2000Q3 through 2001Q4
Recovery • Gross job losses declined rapidly in most all states after 2001Q4 • Only 13 (AZ, GA, HI, ID, KS, LA, MS, NE, NV, SC, TX, UT, WY) states show gross job gains in 2006Q3 greater than gross job gains in 1996Q3 • Since 2003Q3 less than half of all states show gross job gains less than gross job losses in 2 quarters or more
Recovery • 29 states have gross job losses greater than gross job gains in 2006Q3 • CA, MO, NY, OH and PA show lowest levels of gross job gains ever in 2006Q3 • On the brink of another recession or just temporary adjustment from extremely low levels of gross job losses seen in 2006Q1?
Trends in Gross Job Gainsand Gross Job Losses • Difference between summed gross job gains and summed gross job losses from 2002Q1 – 2006Q3 is positive in all but 5 states • However, 22 states have declining trends for gross job gains • Trends for gross job losses showing faster declines than trends for gross job gains is how many states are realizing job growth
Regional Trends • Mid-Atlantic (DE, MD, NJ, PA, VA, WV) • Only 6 states nationally have larger difference between gross job gains and gross job losses than VA over the past 5 years • PA has not had a quarter where gross job losses exceed gross job gains since 2003Q3 and has only happened in 2 quarters in MD since 2003Q1 (2006Q2 and 2006Q3)
Regional Trends • Northeast and Midwest • Only 5 (CT, IA, MN, NE and SD) states have positive trends for gross job gains and declining trends for gross job losses since 2002Q1 • Only 4 (IA, MN, NY and WI) states are in the top half of states in regards to differences of summed gross job gains and summed gross job losses since 2002Q1
Regional Trends • West and Southeast • Six (AZ, CA, FL, NV, TX and WA) states showing the largest positive differences between summed gross job gains and gross job losses since 2002Q1 • Only 7 (AK, CA, KS, KY, MO, NC and TN) states out of 27 showing declining trends in both gross job gains and gross job losses since 2002Q1
Summary • Short-run ebbs and flows of economic activity and job growth are unavoidable • State level BED time series data will prove useful in understanding the underlying labor market forces driving employment dynamics
Contact Information • Eric Simants • simants.eric@bls.gov • 202/691-5193 • Dave Talan • talan.david@bls.gov • 202/691-6467 • Group Email: BDMInfo@bls.gov