
Understanding Normal Distribution for Binomial Experiment Approximation
Learn how the normal distribution helps estimate binomial experiment probabilities by approximating binomial distributions based on key criteria. Understand the significance of continuity correction and how to interpret z-scores to calculate probabilities accurately.

Understanding Normal Distribution for Binomial Experiment Approximation
E N D
Presentation Transcript
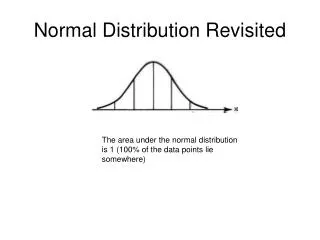
Normal Distribution Revisited The area under the normal distribution is 1 (100% of the data points lie somewhere)
To estimate binomial experiment probabilities • If np>5 and n(1-p)>5 • The normal distribution with • x = np and σ = np(1-p) • Can approximate the binomial distribution of the random variable X
E.G. 100 coins are tossed • Find P(60 coins are heads) • P(60 heads)=100C60(1/2)60(1/2)40 • = 1.08 % • What if I asked the probability that the coin comes up heads 60 times or less?
Without the normal distribution • We could calculate 61 different probabilities and add them all together. • (possible with a computer but impractical otherwise)
Applying the Normal Distribution • x = np and σ = np(1-p) • x=np=100(1/2)=50 • σ = np(1-p) = 100(1/2)(1/2) =5 • Find z score for x=60.5 • Z =60.5 - 50 =2.1 • 5 • P(x < 60)=P(Z<2.1)=98.21% (from z score table page 606-607)
Why did we use 60.5? • I am 32 years old. • My daughter weighs 32 pounds. • Is the 32 in the first sentence the same as the 32 in the second?
In the first 32 means at least 32 but not yet 33 years old. • In the second it means closer to 32 than 31 or 33.
32 years old means in the range • 32<x<33 • 32 pounds means in the range • 31.5<x<32.5
Less than 32 years old would mean less than 32.0 years old. • Less than 32 pounds would mean less than 29.5 pounds. • We use the latter interpretation of whole numbers when using the continuous normal distribution to approximate binomial experiment results.
When we specify that a random variable is less than or equal 60 • We mean in the range from 0 to 60.5 • So we say x = 60.5 and find the z score • to use the associated percentage as the probability that x is less than or equal to 60. • For p(X<60) we would use 59.5 • The 0.5 is called a continuity correction.
To Find the Probability for a Range • P(20<x<30) = P(X<30) - P(X<20)
Relating Back to StatisticsImagine that you want to predict an elections outcome. • You pole 20 people selected through a simple random process to determine who supports TPP (The Political Party) • If in truth, 60% of the population support TPP and the remaining 40% support TOPP (the other political party) what is the probability that your survey predicts the winner correctly?
Probability that the survey is right: Let R.V. X denote the number of sampled people that support TPP. If X>10 then you will accurately predict the outcome of the election. Re-read the question to see why this is so.
P(X>10) • P(X>10)=1-P(X≤10) • Lets find P(X≤10) • µ = np=20(0.6)=14 • σ = sqrt(20(.6)(.4))=4.8 • Z=(10.5-14)/4.8= -0.73 • P(X≤10)=P(Z<-0.73)= 23.27% from Z score table
P(X>10)=1-P(X≤10) • P(X>10)=1- 23.27% = 76.73 %
What if we doubled our sample size? • Everything else remains but n= 40 and we want P(X>20) • P(X>20)=1-P(X≤20) • Lets find P(X≤10) • µ = np=40(0.6)=24 • σ = sqrt(40(.6)(.4))=3.1 • Z=(20.5-24)/3.1= -1.13 • P(X≤10)=P(Z<-1.13)= 12.92% from Z score table • P(X>20)=1-12.92%=87.08% • As you can see, as we increase the sample size, we increase the probability that the conclusion accurately represents the sample.
Limitations: • The above calculations require knowing what the underlying percentage of the population supports TPP ahead of time. • In a real study this is not realistic as there would be no reason to conduct a poll if you already know what the underlying trend is. • You can verify for your self that the probability of predicting accurately depends on the underlying population as well as the sample size (just try changing the 60% in the above example to any other number.
Practice Page 448 • Questions 1 to 11


