Download
1 / 6
60 likes | 82 Views
F distributions are similar to Chi-Square Distributions, utilized for model utility tests in regression analysis. Explore what F tests signify, hypothesis statements, assumptions, and practical implementation.

E N D
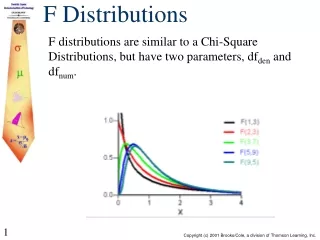
F Distributions F distributions are similar to a Chi-Square Distributions, but have two parameters, dfden and dfnum.
The F Test for Model Utility The regression sum of squares denoted by SSReg is defined by SSREG = SSTo - SSresid
The F Test Utility of the Model y = a + b1x1 + b2x2 + … + bkxk + e • Null hypothesis: • H0: b1 = b2 = … = bk =0 • (There is no useful linear relationship between y and any of the predictors.) • Alternate hypothesis: • Ha: At least one among b1, b2, … , bk is not zero • (There is a useful linear relationship between y and at least one of the predictors.)
The F Test Utility of the Model y = a + b1x1 + b2x2 + … + bkxk + e
The F Test Utility of the Model y = a + b1x1 + b2x2 + … + bkxk + e The test is upper-tailed, and the information in the Table of Values that capture specified upper-tail F curve areas is used to obtain a bound or bounds on the P-value using numerator df = k and denominator df=n-(k+1). Assumptions: For any particular combination of predictor variable values, the distribution of e, the random deviation, is normal with mean 0 and constant variance.