1 / 9

ROC Curve: Auto Repossession Risk Analysis

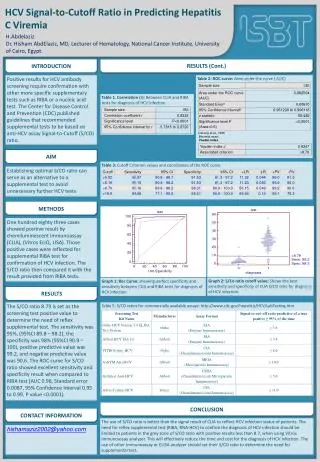
This demo showcases the ROC curve evaluation for auto loan repayment, with sensitivity and specificity comparison between 'repossessed' and 'paid-off' loans. Explore financial responsibility ratings distribution and learn to interpret the results effectively.

donnakim
Download Presentation

ROC Curve: Auto Repossession Risk Analysis

An Image/Link below is provided (as is) to download presentation Download Policy: Content on the Website is provided to you AS IS for your information and personal use and may not be sold / licensed / shared on other websites without getting consent from its author. Content is provided to you AS IS for your information and personal use only. Download presentation by click this link. While downloading, if for some reason you are not able to download a presentation, the publisher may have deleted the file from their server. During download, if you can't get a presentation, the file might be deleted by the publisher.

E N D

Presentation Transcript


  1. ROC Curve Demo

  2. Will auto be repossessed ? <-yes, Y=1, “event”, (H1) | (H0:) Y=0, “non-event”, no -> Distributions of financial responsibility rating for Auto repossessed (left) Auto loan paid off (right) S e n s i t i v i t y <-Repossessed Paid off-> 1-specificity (red proportion to left of cutoff) (black proportion to left of cutoff) Cutoff for slide 1

  3. Sensitivity | Specificity 1-Specificity |

More Related