NERSC Science Highlights
90 likes | 110 Views
NERSC Science Highlights. September, 2010. NERSC Scientific Accomplishments, Q3CY2010. Climate Studies point to intense tropical-cyclone activity as a reason for unusual climatic conditions that prevailed during the early Pliocene, 5 million to 3 million years ago. (A. Fedorov, Yale).

NERSC Science Highlights
E N D
Presentation Transcript
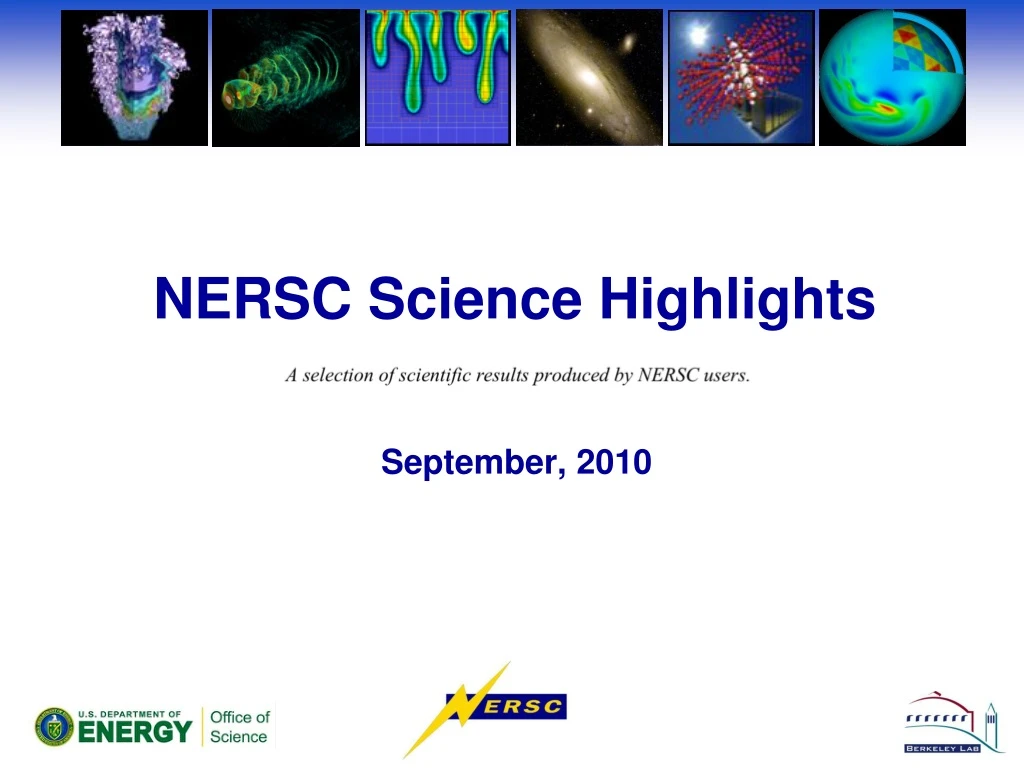
NERSC Science Highlights September, 2010
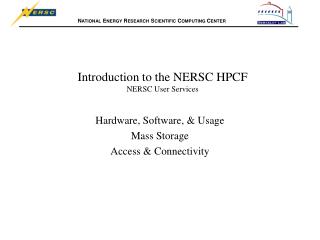
NERSC Scientific Accomplishments, Q3CY2010 Climate Studies point to intense tropical-cyclone activity as a reason for unusual climatic conditions that prevailed during the early Pliocene, 5 million to 3 million years ago. (A. Fedorov, Yale) Energy Resources State-of-the-art electronic structure and first-principles molecular-dynamics show why enzymes may be good models for hydrogen production catalysts. (R. Car, Princeton) . ProteinsA newly-developed technique yields the first reliable interpretation of spectra in one of the most important problems of biophysical chemistry. (Prendergast, LBNL) AstrophysicsA quantum leap in supernova understanding has been obtained by researchers using a 3-D radiation-hydro code on NERSC’s Franklin. (Burrows, Princeton; Bell, LBNL) ClimateResearchers have discovered the exceptional role that flowering plants play in in global climate, keeping our world cool and damp. (Lee / Boyce, U. Chicago) Nuclear PhysicsNERSC’s PDSF and HPSS are the main U.S. computing resources for the ALICE experiment at the LHC. (P. Jacobs, LBNL) 2
New Method Sheds Light on Protein-Salt Interactions Objective: First-principles calculation of X-ray absorption spectra for key biological and chemical systems D. Prendergast, R. Saykally (LBNL) . Implications: Ability to detect subtle differences in molecular structure in the (native) liquid state. • Accomplishments:Newly-developed technique yields first reliable molecular-level interpretation of spectra in one of the most important problems in biophysical chemistry. • Another important example of synergy between experiment & simulation; • Combination of several simulation methods to produce a single result - common at NERSC • NERSC resources allow application at unprecedented system sizes Simulation of triglycine polypeptide and dissolved sodium sulfite in water. Viewing multiple snapshots of this simulation suggests a new mechanism for a phenomenon first observed over 100 years ago. The insert shows the calculated spectrum. Proceedings of the National Academy of Sciences August 10, 2010 ∣ vol. 107 ∣ no. 32 BES
ALICE + NERSC + ESnet = Results Objective: NERSC’s PDSF and HPSS are the main U.S. computing resources for the ALICE experiment at the LHC. P. Jacobs (LBNL) et al. . Implications: ALICE is a forefront experiment for the study of dense QCD matter, achieved through the collision of very heavy ions at high energy. • Accomplishments:NERSC computing and storage resources for ALICE are available to more than 1,000 collaborators worldwide via the ALICE Grid. • ALICE has already produced a publication based on 284 events recorded in the detector on the first day of the LHC's operation. Left: Trace of one of the first 7-TeV particle collisions registered by the ALICE detector from two oppositely rotating proton beams. Right: View of a NERSC HPSS tape robot that will help store the expected 60TB per month of ALICE data. NERSC:PDSF, with its incremental upgrade capability, is a key part of a distributed Tier-2 ALICE computing facility. Eur. Phys. Journal C, 11 December 2009 NP
"Sweaty" Flowers Cool the World Objective: Improve the representation of terrestrial carbon processes in coupled carbon-climate models. J-E. Lee, C.K. Boyce (U Chicago) . Implications: More accurate prediction of future atmospheric CO2 levels and the timing and magnitude of climate change. • Accomplishments:Discovered that the world is a cooler, wetter place because of flowering plants. • Due to higher vein density in flowering plants, which are more efficient at transpiring water back into the sky, where it can return to Earth as rain. Left: Blue regions of this world map show where annual precipitation is higher because of flowering plants, according to NERSC supercomputer simulations. Right: comparison of vein density in two leaves – the one from a flowering plant is eight times higher. • NERSC: Used CAM, the Community Atmosphere Model, on Bassi. Proceedings of the Royal Society B, June 16, 2010. BER
What’s Pliocene Got to Do With it? Objective: Explore feedback between ocean overturning circulation and tropical cyclones, especially to understand climate during the Pliocene epoch (3-5M years ago). A. Fedorov, C. Brierley (Yale) A coupled climate/hurricane simulation run at NERSC has shown that cyclone activity in the central Pacific during the early Pliocene (5 to 3 million years ago), a period often taken as a close analogue to contemporary global warming, may have contributed to maintaining a permanent El Niño-like state. Implications: Many climate factors during Pliocene were the same as today; yet temperatures were ~4 oC warmer than today. Why? What role did cyclones play? • Accomplishments: Used a fully-coupled ocean-atmosphere circulation model to reconstruct frequency & distribution of cyclones during the Pliocene. • Showed that cyclones were much more frequent and longer-lasting than today. • This “fed back” to result in further warming. Nature, Science Daily Nature News & Views 25 February 2010 (cover story) NERSC:Computations done using CCSM, CAM, and a statistical cyclone model on Franklin (240 cores for runs and 1-4 cores for post-processing). BER
You Need 3D to Watch Stars Explode Objective: Understanding supernova core collapse – perhaps the single most energetic event in the cosmos. A. Burrows, J. Nordhaus (Princeton); J. Bell, A. Almgren (LBNL) Implications: Despite their importance no supernova has even been completely modeled from first principles. • Accomplishments: Used CASTRO radiation-hydrodynamics code; explored the spatial dimension dependence of neutrino heating. • Found that likelihood of an explosion is a direct function of dimensionality: 3D>2D>1D • Effect is larger than many science effects such as relativity & scattering • Quantum leap in supernova understanding. • Suggests that computer power is key limit. Comparison of simulations showing the importance of higher spatial dimensionality. In the top two panels, only the 2-D simulation on the right yields a supernova explosion. In the bottom two the 3-D simulation (right) is vastly different from that of the corresponding 2D run (left). NERSC:NISE recipient; runs on Franklin use 256-16,384 cores, typically 8,192; Visualization using ViSIT on Franklin The Astrophysical Journal 720 (2010) 694 HEP
Simulation of Electrocatalytic Hydrogen Production by a Bio-inspired Catalyst Objective: Simulation-based design of a catalyst for hydrogen production using an enzyme’s active site as the foundation. R. Car, A. Selloni (Princeton) Implications: Economically sustainable production of bulk hydrogen from water – a clean, renewable route to hydrogen energy. Two snapshots from a molecular dynamics simulation showing hydrogen being assembled on a catalyst from two hydrogen ions (see the arrow in both figures). After this the hydrogen molecule is released. • Accomplishments: State-of-the-art electronic structure and first-principles molecular-dynamics studies of an enzyme’s metal center attached to an electrode in water. • First-principles molecular-dynamics simulations at an • advanced level of system complexity NERSC: Uses NERSC-compiled versions of Quantum ESPRESSO and CPMD software (and this is the group that invented CPMD) J. Chemical Theory & Computation, vol 6(11) pp 3490–3502 (2010) BES
About the Cover Low swirl burner combustion simulation. Image shows flame radical, OH (purple surface and cutaway) and volume rendering (gray) of vortical structures. Red indicates vigorous burning of lean hydrogen fuel; shows cellular burning characteristic of thermodiffusively unstable fuel. Simulated using an adaptive projection code. Image courtesy of John Bell, LBNL. Hydrogen plasma density wake produced by an intense, right-to-left laser pulse. Volume rendering of current density and particles (colored by momentum orange - high, cyan - low) trapped in the plasma wake driven by laser pulse (marked by the white disk) radiation pressure. 3-D, 3,500 Franklin-core, 36-hour LOASIS experiment simulation using VORPAL by Cameron Geddes, LBNL. Image courtesy of Cameron Geddes.. Numerical study of density driven flow for CO2 storage in saline aquifers. Snapshot of CO2 concentrationafter convection starts. Density-driven velocity field dynamics induces convective fingers that enhance the rate by which CO2 is converted into negatively buoyant aqueous phase, thereby improving the security of CO2 storage. Image courtesy of George Pau, LBNL False-color image of the Andromeda Galaxy created by layering 400 individual images captured by the Palomar Transient Factory (PFT) camera in February 2009. NERSC systems analyzing the PTF data are capable of discovering cosmic transients in real time. Image courtesy of Peter Nugent, LBNL. The exciton wave function (the white isosurface) at the interface of a ZnS/ZnO nanorod. Simulations performed on a Cray XT4 at NERSC, also shown. Image courtesy of Lin-Wang Wang, LBNL. Simulation of a global cloud resolving model (GCRM). This image is a composite plot showing several variables: wind velocity (surface pseudocolor plot), pressure (b/w contour lines), and a cut-away view of the geodesic grid. Image courtesy of Professor David Randall, Colorado State University.