A Quick Introduction to Approximate Query Processing Part II
250 likes | 418 Views
A Quick Introduction to Approximate Query Processing Part II. CS286, Spring’2007 Minos Garofalakis. Decision Support Systems. Data Warehousing: Consolidate data from many sources in one large repository. Loading, periodic synchronization of replicas. Semantic integration. OLAP:

A Quick Introduction to Approximate Query Processing Part II
E N D
Presentation Transcript
A Quick Introduction to Approximate Query ProcessingPart II CS286, Spring’2007 Minos Garofalakis
Decision Support Systems • Data Warehousing: Consolidate data from many sources in one large repository. • Loading, periodic synchronization of replicas. • Semantic integration. • OLAP: • Complex SQL queries and views. • Queries based on spreadsheet-style operations and “multidimensional” view of data. • Interactive and “online” queries. • Data Mining: • Exploratory search for interesting trends and anomalies. (Another lecture!)
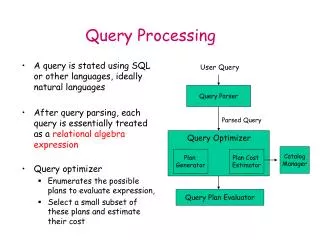
Approximate Query Processing using Data Synopses Compact Data Synopses “Transformed” Query Approximate Answer KB/MB FAST!! • How to construct effective data synopses ?? DecisionSupport Systems(DSS) SQL Query Exact Answer Long Response Times! GB/TB
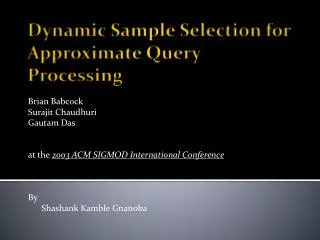
Relations as Frequency Distributions sales salary name age One-dimensional distribution tuple counts Age (attribute domain values) Three-dimensional distribution tuple counts 8 10 10 age 30 20 50 sales 25 8 15 salary
Outline • Intro & Approximate Query Answering Overview • Synopses, System architectures, Commercial offerings • One-Dimensional Synopses • Histograms: Equi-depth, Compressed, V-optimal, Incremental maintenance, Self-tuning • Samples: Basics, Sampling from DBs, Reservoir Sampling • Wavelets: 1-D Haar-wavelet histogram construction & maintenance • Multi-Dimensional Synopses and Joins • Set-Valued Queries • Discussion & Comparisons • Advanced Techniques & Future Directions
One-Dimensional Haar Wavelets [1.5, 4] [0.5, 0] [2.75] [-1.25] Haar wavelet decomposition: [2.75, -1.25, 0.5, 0, 0, -1, -1, 0] • Wavelets: mathematical tool for hierarchical decomposition of functions/signals • Haar wavelets: simplest wavelet basis, easy to understand and implement • Recursive pairwise averaging and differencing at different resolutions Resolution Averages Detail Coefficients 3 [2, 2, 0, 2, 3, 5, 4, 4] ---- 2 [2, 1, 4, 4] [0, -1, -1, 0] 1 0
Haar Wavelet Coefficients + 2.75 - 2.75 + + - -1.25 -1.25 - -1 0 0.5 -1 0 0 + + - + - - 0.5 + 0 + - + - + - + - - + - + 2 2 0 2 3 5 4 4 0 + - -1 + - -1 + 0 • Hierarchical decomposition structure (a.k.a. “error tree”) Coefficient “Supports” Original data
Wavelet-based Histograms [MVW98] • Problem: range-query selectivity estimation • Key idea: use a compact subset of Haar/linear wavelet coefficients for approximating the data distribution • Steps • compute (cumulative) data distribution C • compute Haar (or linear) wavelet transform of C • coefficient thresholding : only b<<|C| coefficients can be kept • take largest coefficients in absolutenormalized value • Haar basis: divide coefficients at resolution j by • Optimal in terms of the overall Mean Squared (L2) Error • Greedy heuristic methods • Retain coefficients leading to large error reduction • Throw away coefficients that give small increase in error
Haar Wavelet Coefficients + 2.75 + - -1.25 0.5 0 0 -1 0 -1 + - + - + - + - + - + - 2 2 0 2 3 5 4 4 • Reconstruct data values d(i) • d(i) = (+/-1) * (coefficient on path) • Range sum calculation d(l:h) • d(l:h) = simple linear combination of coefficients on paths to l, h • Only O(logN) terms Original data 3 = 2.75 - (-1.25) + 0 + (-1) 6 = 4*2.75 + 4*(-1.25)
Dynamic Maintenance of Wavelet-based Histograms [MVW00] Change propagates up to the root coefficient d • Build Haar-wavelet synopses on the original data distribution • Key issues with dynamic wavelet maintenance • Change in single distribution value can affect the values of many coefficients (path to the root of the decomposition tree) d+ • As distribution changes, “most significant” (e.g., largest) coefficients can also change! • Important coefficients can become unimportant, and vice-versa
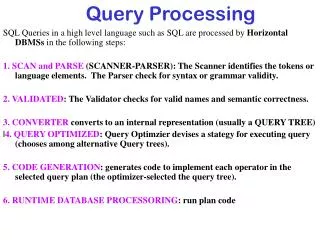
Problems with Conventional Wavelet Synopses Always accurate! Over 2,000% relative error! Estimate = 195, actual values: d(0:2)=285, d(3:5)=93! • An example data vector and wavelet synopsis (|D|=16, B=8 largest coefficients retained) Original Data Values 127 71 87 31 59 3 43 99 100 42 0 58 30 88 72 130 Wavelet Answers 65 65 65 65 65 65 65 65 100 42 0 58 30 88 72 130 • Large variation in answer quality • Within the same data set, when synopsis is large, when data values are about the same, when actual answers are about the same • Heavily-biased approximate answers! • Root causes • Thresholding for aggregate L2 error metric • Independent, greedy thresholding ( large regions without any coefficient!) • Heavy bias from dropping coefficients without compensating for loss
Approach: Optimize for Maximum-Error Metrics • Key metric for effective approximate answers: Relative error with sanity bound • Sanity bound “s” to avoid domination by small data values • To provide tight error guarantees for all reconstructed data values • Minimize maximum relative error in the data reconstruction • Another option: Minimize maximum absolute error • Algorithms can be extended to general “distributive” metrics (e.g., average relative error) Minimize
Our Approach: Deterministic Wavelet Thresholding for Maximum Error root=0 S = subset of proper ancestors of j included in the synopsis + - j 2j+1 2j • Key Idea: Dynamic-Programming formulation that conditions the optimal solution on the error that “enters” the subtree (through the selection of ancestor nodes) • Our DP table: M[j, b, S] = optimal maximum relative (or, absolute) error in T(j) with space budget of b coefficients (chosen in T(j)), assuming subset S of j’s proper ancestors have already been selected for the synopsis • Clearly, |S| min{B-b, logN+1} • Want to compute M[0, B, ] • Basic Observation: Depth of the error tree is only logN+1 we can explore and tabulate all S-subsets for a given node at a space/time cost of only O(N) !
Base Case for DP Recurrence: Leaf (Data) Nodes Selected coefficient subset S root=0 + - j/2 • Base case in the bottom-up DP computation: Leaf (i.e., data) node • Assume for simplicity that data values are numbered N, …, 2N-1 • M[j, b, S] is not defined for b>0 • Never allocate space to leaves • For b=0 for each coefficient subset with |S| min{B, logN+1} • Similarly for absolute error • Again, time/space complexity per leaf node is only O(N)
DP Recurrence: Internal (Coefficient) Nodes j 2j+1 2j • Two basic cases when examining node/coefficient j for inclusion in the synopsis: (1) Drop j; (2) Keep j Case (1): Drop Coefficient j • In this case, the minimum possible maximum relative error in T(j) is S = subset of selected j-ancestors root=0 • Optimally distribute space b between j’s two child subtrees • Note that the RHS of the recurrence is well-defined • Ancestors of j are obviously ancestors of 2j and 2j+1 + -
DP Recurrence: Internal (Coefficient) Nodes (cont.) j 2j+1 2j Case (2): Keep Coefficient j • In this case, the minimum possible maximum relative error in T(j) is S = subset of selected j-ancestors root=0 • Take 1 unit of space for coefficient j, and optimally distribute remaining space • Selected subsets in RHS change, since we choose to retain j • Again, the recurrence RHS is well-defined + - • Finally, define • Overall complexity: time, space
Outline • Intro & Approximate Query Answering Overview • One-Dimensional Synopses • Multi-Dimensional Synopses and Joins • Multi-dimensional Histograms • Join sampling • Multi-dimensional Haar Wavelets • Set-Valued Queries • Discussion & Comparisons • Advanced Techniques & Future Directions • Conclusions
Relations as Frequency Distributions sales salary name age One-dimensional distribution tuple counts Age (attribute domain values) Three-dimensional distribution tuple counts 8 10 10 age 30 20 50 sales 25 8 15 salary
Multi-dimensional Data Synopses 35 Salary 90 40 120 20 10 Age • Problem: Approximate the joint data distribution of multiple attributes • Motivation • Selectivity estimation for queries with multiple predicates • Approximating OLAP data cubes and general relations • Conventional approach: Attribute-Value Independence (AVI) assumption • sel(p(A1) & p(A2) & . . .) = sel(p(A1)) * sel(p(A2) * . . . • Simple -- one-dimensional marginals suffice • BUT: almost always inaccurate, gross errors in practice (e.g., [Chr84, FK97, Poo97]
Multi-dimensional Histograms Approximate Distribution 16 10 • Use small number of multi-dimensional buckets to directly approximate the joint data distribution • Uniform spread & frequency approximation within buckets • n(i) = no. of distinct values along Ai, F = total bucket frequency • approximate data points on a n(1)*n(2)*. . . uniform grid, each with frequency F / (n(1)*n(2)*. . .) Actual Distribution (ONE BUCKET) 35 90 40 120 20
Multi-dimensional Histogram Construction • Construction problem is much harder even for two dimensions [MPS99] • Multi-dimensional equi-depth histograms [MD88] • Fix an ordering of the dimensions A1, A2, . . ., Ak, let kth root of desired no. of buckets, initialize B = { data distribution } • For i=1, . . ., k: Split each bucket in B in equi-depth partitions along Ai; return resulting buckets to B • Problems: limited set of bucketizations; fixed and fixed dimension ordering can result in poor partitionings • MHIST-p histograms [PI97] • At each step • Choose the bucket b in B containing the attribute Ai whose marginal is the most in need of partitioning • Split b along Ai into p (e.g., p=2) buckets
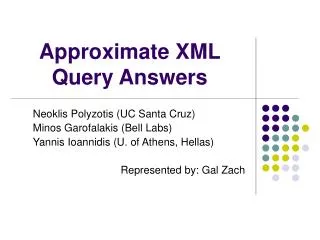
Equi-depth vs. MHIST Histograms 1 1 5 30 30 4 2 2 4 200 200 10 10 50 150 50 150 150 150 50 50 150 150 5 3 3 280 280 Equi-depth (a1=2,a2=3) [MD88] MHIST-2 (MaxDiff) [PI97] A2 A2 460 360 250 A1 A1 450 280 340 • MHIST: choose bucket/dimension to split based on its criticality ; allows for much larger class of bucketizations (hierarchical space partitioning) • Experimental results verify superiority over AVI and equi-depth
Other Multi-dimensional Histogram Techniques -- STHoles [BCG01] |q&b|=160 b1 b1 q 160 Refine 40 b2 b2 b3 b3 b5 b4 b4 150 100 300 • Multi-dimensional, workload-based histograms • Allow bucket nesting -- “bucket tree” • Intercept query result stream and count |q b| for each bucket b (< 10% overhead in MS SQL Server 2000) • Drill “holes” in b for regions of different tuple density and “pull” them out as children of b (first-class buckets) • Consolidate/merge buckets of similar densities (keep #buckets constant) 200 150 100 300
Sampling for Multi-D Synopses Size of Join of samples = 3 • Taking a sample of the rows of a table captures the attribute correlations in those rows • Answers are unbiased & confidence intervals apply • Thus guaranteed accuracy for count, sum, and average queries on single tables, as long as the query is not too selective • Problem with joins [AGP99,CMN99]: • Join of two uniform samples is not a uniform sample of the join • Join of two samples typically has very few tuples Foreign Key Join 40% Samples in Red Size of Actual Join = 30 3 1 0 3 7 3 7 1 4 2 4 0 1 21270 8 5 1 9 1 0 7 1 3 8 2 0 0 1 2 3 4 5 6 7 8 9
Join Synopses for Foreign-Key Joins [AGP99] • Based on sampling from materialized foreign key joins • Typically < 10% added space required • Yet, can be used to get a uniform sample of ANY foreign key join • Plus, fast to incrementally maintain • Significant improvement over using just table samples • E.g., for TPC-H query Q5 (4 way join) • 1%-6% relative error vs. 25%-75% relative error, for synopsis size = 1.5%, selectivity ranging from 2% to 10% • 10% vs. 100% (no answer!) error, for size = 0.5%, select. = 3%