What-if Analysis (sensitivity analysis) for Linear Programming
What-if Analysis (sensitivity analysis) for Linear Programming. Introduction. Assumption: The parameters of the model were known with certainty In Reality: the model parameters are simply estimates that are subject to change Example (RMC Problem).

What-if Analysis (sensitivity analysis) for Linear Programming
E N D
Presentation Transcript
What-if Analysis (sensitivity analysis) for Linear Programming ADM2302 /Rim Jaber
Introduction • Assumption: The parameters of the model were known with certainty • In Reality: the model parameters are simply estimates that are subject to change • Example (RMC Problem) ADM2302 /Rim Jaber
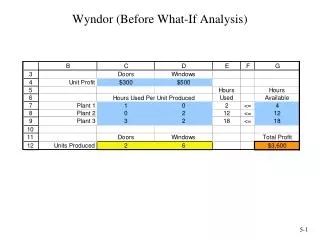
RMC, Inc. is a firm that produces chemical based products. In a particular process three raw materials are used to produce two products. The Material requirements per ton are: Product Material 1 Material 2 Material 3 Fuel additive 2/5 0 3/5 Solvent base 1/2 1/5 3/10 For the current production period RMC has available the following quantities of each raw material. Because of spoilage, any materials not used for current production must be discarded. Number of Tons Material Available for Production Material 1 20 Material 2 5 Material 3 21 If the contribution to the profit is $40 for each ton of fuel additive and $30 for each ton of solvent base, How many tons of each product should be produced in order to maximize the total contribution profit? ADM2302 /Rim Jaber
Introduction (cont’d) RMC Problem Formulation (refer also “RMC_problem.xsl”) Max Z = $ 40 x1 + 30 x2 Subject to 2/5 x1 + 1/2 x2 20 1/5 x2 5 3/5 x1 + 3/10 x2 21 x1 0, x2 0 x1: number of tons of fuel additive that RMC produces x2: number of tons of solvent base that RMC produces
Answer Report ADM2302 /Rim Jaber
Sensitivity Report ADM2302 /Rim Jaber
Introduction (cont’d) • What_if Analysis = Sensitivity Analysis = Postoptimality Analysis = Parametric Programming = Optimality Analysis • The analysis of the effect of parameter changes (coefficient of the LP problem) on the optimal solution • Centered around “What-if question?” ADM2302 /Rim Jaber
Outline • Changes in the Objective Functions Coefficients • Changes in the Right-Hand Sides (RHS) Values (changes in constraint quantity values) • Shadow Prices • Range of Feasibility • Simultaneous Changes in the Objective Function Coefficients • Simultaneous Changes in the RHS • Reduced cost • Pricing out New variables ADM2302 /Rim Jaber
Changes in the Objective Functions Coefficients • Definition: • c1: the objective function coefficient of x1 (c1= ) • c2: the objective function coefficient of x2 (c2 = ) Purpose • Sensitivity analysis is performed to determine the range for cj over which the current solution remain optimal • This can be directly obtained from Excel’s sensitivity report ADM2302 /Rim Jaber
Changes in the Objective Functions Coefficients (cont’d) • Graphically • Changes in the objective function coefficients values do not affect the size of the feasible region • The range of optimality • The range of values over which a variable’s coefficient can change without causing a change in the optimal solution (x1= 25, x2= 20) is: • 24 c1 60 (refer to the Excel Sensitivity analysis report) • 20 c2 50 (refer to the Excel Sensitivity analysis report) ADM2302 /Rim Jaber
Changes in the Objective Functions Coefficients (cont’d) • What about the value of Z? • Zero value decision variable (unused activity) • The value of the objective function, Z, will not change. • Non Zero value decision variables • The value of Z, will change. ADM2302 /Rim Jaber
Changes in the Objective Functions Coefficients (cont’d) • Question : What happen if the estimate of the unit profit of ONE of the RMC’s chemical based product is inaccurate? • Answer: The range of values is wide for both objective function coefficients. Thus we can still be confident that we have obtained the correct optimal solution. ADM2302 /Rim Jaber
Changes in the Right-Hand Sides (RHS) values • = Changes in constraints quantity values = changes in resources = changes in the managerial policy decisions • qi = the RHS value for constraint i • q1 = 20 , q2 = 5 and q3 = 21 • Graphically • A change in qi usually affect the size of the feasible region and often the value of the optimal solution ADM2302 /Rim Jaber
x2 50 40 (0, 25) (18.75,25) 30 Optimal Solution Point (25,20) 20 (0,0) (35,0) 10 x1 40 0 20 50 10 30 ADM2302 /Rim Jaber
Changes in the Right-Hand Sides (RHS) values (cont’d) • Shadow Price • The value of an additional unit of resources (e.g. an additional 1 ton of Material 1 will increase my profit by how much? Is it worth it?) • How to find the value of the shadow price? • Increase the RHS by one in the spreadsheet, and solve • Look at the sensitivity report ADM2302 /Rim Jaber
Changes in the Right-Hand Sides (RHS) values (cont’d) Shadow Prices (Definitions): • Is the marginal profit of additional unit of resource • The maximum price you are willing to pay for 1 unit of the resources • Amount by which profit will decrease if the availability of the resource associated with the constraint is reduced by 1 unit. ADM2302 /Rim Jaber
Changes in the Right-Hand Sides (RHS) values (cont’d) Purpose • The effect on the optimal value if a small change were to be made in the RHS constraint (done for each constraint, one at a time). • We want to find the range value of qi over which the shadow prices remain valid the range over which the solution remain feasible (x1 and x2 remain different than zero, however their values may change) ADM2302 /Rim Jaber
Changes in the Right-Hand Sides (RHS) values (cont’d) • Range of Feasibility • The range of values over which the value of the right hand side (qi) can vary without causing a change in the corresponding shadow price value • 14 <= q1 <= 21.5 • 4 <= q2 • 18.75 <= q3 <= 30 ADM2302 /Rim Jaber
Changes in the Right-Hand Sides (RHS) values (cont’d) • Changes in the right hand side of a binding constraint causes the value of the optimal solution to change. • What about changes in the right hand side of a none binding constraint? ADM2302 /Rim Jaber
Simultaneous Changes in the Objective Function Coefficients • The range of values discussed is based on the assumption that only one coefficient changes, and all the other coefficients remain the same (accurate) • Purpose • determine, without solving the problem, whether optimal solution may change if certain changes occur simultaneously in the coefficients of the objective function (given that those changes are within the corresponding range) ADM2302 /Rim Jaber
100 Percent Rule for Objective Function Coefficients • For all objective function coefficients that are changed, sum the percentage of the allowable increases and the allowable decreases represented by the changes. If the sum of the percentage changes does not exceed 100%, the optimal solution will not change • (Change / Allowable change)*100 100 ADM2302 /Rim Jaber
100 Percent Rule for Objective Function Coefficients • Example (optimal solution does not change) • c1: 40 50 and c2: 30 35 Percentage allowable increase for c1 = (50-40)/ (allowable increase for c1) % = (50-40)/20 (100) = 50 % Percentage allowable increase for c2 = (35-30)/ (allowable increase for c2) % = (5)/20 (100) = 25 % Sum= 50% + 25% = 75% <100% ADM2302 /Rim Jaber
100 Percent Rule for Objective Function Coefficients Example: c1: 40 25 and c2: 30 40 Percentage allowable decrease for c1 = (40-25)/ (allowable decrease for c1) % = (15/16) (100) = 93.5 % Percentage allowable increase for c2 = (40-30)/ (allowable increase for c2) % = 10/20 (100) = 50 % Sum= 93.5 % + 50% = 143.5% >100% Since the 100% is not satisfied we must resolve the problem to determine if the optimal solution will change or not ADM2302 /Rim Jaber
Simultaneous changes in the RHS • The 100 percent Rule: • For all right hand side that are changed (with their corresponding range of feasibility), sum percentages of allowable increases and allowable decreases. If the sum does not exceed 100% then the shadow prices will not change • Example: • Q1: 20 21 , 14 <= Q1 <=21.5 • Q2: 5 4, 4 <= Q2 • Q3: 21 24 , 18.75 <= Q3 <= 30 ADM2302 /Rim Jaber
100 Percent Rule for the RHS • Example solution: • Shadow prices remain valid, did not change (refer to the excel file) ADM2302 /Rim Jaber
Reduced Cost • Reduced cost of an unused activity is: • The amount by which the profit contribution of an activity (objective function coefficient) needs to be increased before producing this activity • the amount by which the profit will decrease if 1 unit of this activity is forced into the solution ADM2302 /Rim Jaber
Multiple optimal solution • Zero in the “final value” and reduced cost” column • zero in the “allowable increase” or “allowable decrease” columns of the adjustable cell table ADM2302 /Rim Jaber
Pricing-out New Variables • Information given in sensitivity report can be used to study impact of introduction of new decision variables (products). • For example: • If problem is re-solved with a new product in model, will it be recommend that a new product be made? • Or, will it be recommend that a new product not be made, and continue making same products (that is, Fuel additive and solvent base)? ADM2302 /Rim Jaber
Pricing-out New Variables (cont’d) • Suppose RMC, Inc. wants to produce another chemical based products ultra base (x3). • 0.1 ton of material 1 • 0.1 ton of material 2 • 0.8 ton of material 3 • $35 for each ton ADM2302 /Rim Jaber
Pricing-out New Variables (cont’d) • Checking validity of the shadow price using 100% rule • Compute the opportunity cost: marginal worth of the resources that would be diverted from existing product + cost of making the product (it is 0 in this example) • Opportunity cost > profit contribution • Do not produce the product ADM2302 /Rim Jaber
Pricing-out New Variables (cont’d) ADM2302 /Rim Jaber
Summary of Sensitivity Report for Changes in the Objective Function Coefficients • Final Value • The value of the decision variables (changing cells) in the optimal solution. • Reduced Cost • Increase in the objective function value per unit increase in the value of a zero value variable (for small increases)—may be interpreted as the shadow price for the nonnegativity constraint. • Objective Coefficient • The current value of the objective coefficient. • Allowable Increase/Decrease • Defines the range of the coefficients in the objective function for which the current solution (value of the decision variables or changing cells in the optimal solution) will not change.
Summary of Sensitivity Report for Changes in the Right-Hand-Sides • Final Value • The usage of the resource (or level of benefit achieved) in the optimal solution—the left-hand side of the constraint. • Shadow Price • The change in the value of the objective function per unit increase in the right-hand-side of the constraint (RHS): ∆Z = (Shadow Price)(∆RHS) • (Note: only valid if change is within the allowable range—see below.) • Constraint R.H. Side • The current value of the right-hand-side of the constraint. • Allowable Increase/Decrease • Defines the range of values for the RHS for which the shadow price is valid and hence for which the new objective function value can be calculated. (NOT the range for which the current solution will not change.)