Download
1 / 10
110 likes | 318 Views
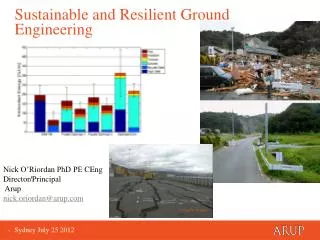
NSA. Engineering, Inc. Ground Imaging Technology and Geotechnical Engineering. RockVision3D TM A Tomographic Imaging System for Civil Applications. NSA Engineering, Inc 15000 W. Sixth Ave., Suite 100 Golden, CO 80401 USA Phone (303) 277-9920 Fax (303) 277-9921 dneil@naainc.com

E N D
NSA Engineering, Inc. Ground Imaging Technology and Geotechnical Engineering RockVision3DTM A Tomographic Imaging System for Civil Applications NSA Engineering, Inc 15000 W. Sixth Ave., Suite 100 Golden, CO 80401 USA Phone (303) 277-9920 Fax (303) 277-9921 dneil@naainc.com www.sni.net/~dneil
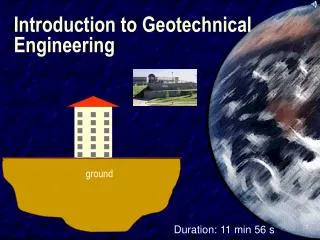
What is RockVision3DTM Seismic Tomography? Imaging the extent of bridge piers within the bridge foundation. 2D Image 3D Image Ray Paths
0 0 0 100 100 100 200 200 200 300 300 300 400 400 400 500 500 500 600 600 600 700 700 700 0 100 200 300 400 500 600 700 Distance, ft Distance, ft Distance, ft Distance, ft Forward Models to Determine the Accuracy of Results Forward Model Input Parameters Fault Gouge Nominal Coverage Region High Coverage Region Ray Paths Higher Resolution Sources/Receivers on Surface and in 4 holes Fault Gouge Lower Resolution Sources/Receivers on Surface and in 1 hole Fault Gouge
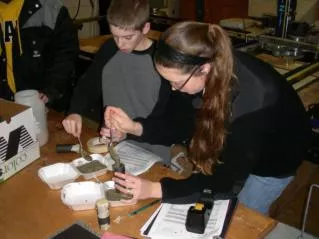
RockVision3DTM A Tomographic Imaging System for Civil Applications Low Velocity Areas of Very Weak Ground Tunnel Alignment Elevated Velocity Tunnel Alignment Areas of Possible Strong Ground 25 (27.04, 20.85) 15 Seismic Sources = 30o 5 (-5, 2.35) ? A Major fracture zone (0, 0) Tunnel Alignment ? Meters ? ? (-5, -2.35) -5 =25o Seismic Receivers -15 TBM Face Position (28.5, -18) -25 -35 -25 -15 35 -5 15 25 5 Meters NSA Engineering, Inc 15000 W. Sixth Ave., Suite 100 Golden, CO 80401 USA Phone (303) 277-9920 Fax (303) 277-9921 IMAGING MICROTUNNEL ALIGNMENT Four potential paths for a planned sanitary sewer microtunnel were evaluated. Areas of possibly strong and very weak ground along the tunnel alignment were identified. The location and configuration of boulders along the alignment as identified by the RockVision3DTM system were verified during tunnel excavation. MAPPING FRACTURE ZONES AHEAD OF A TBM 100 30 30 80 100 60 Tomography results clearly mapped the extent of a failed zone to the right-hand side of a tunnel and mapped five other fracture zones that are anticipated to cross at 15 to 25 m ahead of the TBM. Results were in agreement with geological mapping and core testing. 30 80 25 20 100 80 15 60 10 40 RQD 20 5 0 TBM 0 20 5 RQD 40 Failed zone 10 60 15 80 20 100 25 30 60 Weighted average 30
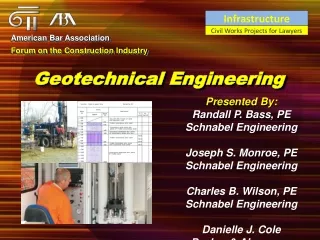
0 m 0 m -2 m -2 m -4 m -4 m -6 m -6 m Velocity Scale m/s -8 m -8 m 950 100 1,800 -10 m -10 m -12 m -12 m -14 m -14 m -16 m -16 m -18 m -18 m -20 m -20 m -22 m -22 m -24 m -24 m -26 m -26 m Higher Velocity Lower Velocity 10,000 ft/sec 3-D Imaging of Grouted Zones With Cross-Hole Tomography Natural ground -3 m Beginning of grouted zone -8 m Middle of grouted zone -13 m End of grouted zone -17 m -24 m Natural ground Vertical Cross-section Horizontal Cross-section 3D Image The 3-D cross-hole tomographic imaging system was used below a tunnel floor to characterize the effectiveness of low pressure jet grouting. Characterization of Well-Log Images Ray Paths High Pressure Jet Grouted Zones Post-Grouting Pre-Grouting Tomo 1 Tomo 1 Tomo 2 Tomo 2 Tomo 3 Tomo 3 Pre- and post-grout images beneath river bottom formation underlying the foundation of a pier for a bridge structure. Images correlated with information obtained from well-log geological data. The results were used to delineate clay-filled zones and to determine the effectiveness of grouting.
G-3 G-1 G-2 G-7 G-5 G-4 G-6 Color scale, ft/s 12,000 10,000 8,000 6,000 4,000 2,000 3-D Imaging of Ground Anomalies using Cross-Hole Seismic Tomography in Open Pit Mine IMAGING THE EXTENT OF SUBSIDED ZONE UNDER A MINE CRUSHER Weak zone Seven holes, 50 feet deep were used to identify the extent of weak anomalies below the surface that attributed to differential subsidence under a mine crusher. 50 ft 124 ft IMAGING THE EXTENT OF AN OLD SHAFT 3-D seismic tomogram generated by the RockVision3DTM system using four holes provided a partial image of an old shaft in one of the benches of the open pit. It also allowed an assessment of directional velocity change associated with fracturing the rock caused by blasting. View of the Shaft in the Bench Three-dimensional Image of the Shaft
3-D Imaging of Ground Anomalies using Cross-Hole Seismic Tomography for a Subway Construction N S Three-dimensional velocity contours for 5,200 ft/sec (blue), 7,500 ft/sec (green), 9,000 ft/sec (yellow), and 10,000 ft/sec (red). Deepening of bedrock in southern half of the site is shown. Purple lines are logged holes and black lines are survey wells PW-1 to PW-7. Velocity Scale ft/s 2,000 12,000 S N Velocity Scale ft/s 2,000 12,000 S N El. +40 ft. El. +5 ft El. -30 ft. El. -65 ft. 1/Attenuation factor 1 300