Download
1 / 47
470 likes | 605 Views
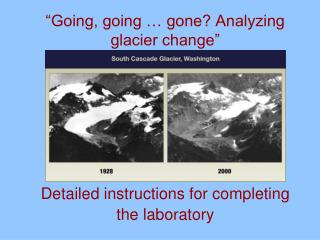
“Going, going … gone? Analyzing glacier change” Detailed instructions for completing the laboratory. Organization of this Lab. Activity 1: Analyze media stories on the effect of global warming on glacial retreat in terms of glacial processes Activity 2: Develop your hypothesis

E N D
“Going, going … gone? Analyzing glacier change”Detailed instructions for completing the laboratory
Organization of this Lab • Activity 1: Analyze media stories on the effect of global warming on glacial retreat in terms of glacial processes • Activity 2: Develop your hypothesis • Activity 3: Test your hypothesis by gathering data on the Nisqually Glacier • Activity 4: Compare Nisqually behavior with other glaciers • Activity 5: Predict future change to glaciers
Activity 1: Analyze media stories on the effect of global warming on glacial retreat in terms of glacial processes • Many videos you can watch on YouTube: http://youtube.com/watch?v=UGclsV3JuAQ http://youtube.com/watch?v=Pem4fpMwkSQ http://youtube.com/watch?v=7MXazI568Bs Just search “glacier retreat” • Media loves the visuals of glacial retreat…
Activity 1: Analyze media stories on the effect of climate change on glacial retreat in terms of glacial processes • You will read media stories
Activity 2: Develop your hypothesis Entire Book, The Scientific Nature of Geomorphology ed. by Rhoads & Thorn SODA
Activity 2: Develop your hypothesis • Read Hecht & Pelto; what are their hypotheses?
Activity 3: Test your hypothesis by gathering data on the Nisqually Glacier • Background information on the study area • Methods used to study glacier change… • Task 1. You measure how the length of the Nisqually Glacier changes over time • Task 2. Analyzing uncertainty • Task 3. Plot your data • Task 4. Comparison with atmospheric temperature • Task 5. Comparison with other glacier length records
Activity 3: Background on study area Fly around and two QTVRs
Activity 3: Background on study area Glacier in various positions “above” bridge Bridge marking previous glacier advance
Mt. Rainer through time (courtesy of NPS)
Activity 3: Methods Lots of techniques… field methods mapping terminus historical photos ground photos maps From a Master’s thesis…
Activity 3: Task 1. Measure length of Nisqually Glacier & how changes 1971
Activity 3: Task 1. Measure length of Nisqually Glacier & how changes
Take a string (or ruler). Measure length from the top of Rainier. Then, compare with scale. Then convert km to miles. Activity 3: Task 1. Measure length of Nisqually Glacier & how changes
Ground Photos require that you look for features on the topographic map that can help you identify location of terminus
Working with ground photos can bedifficult and can have low confidence From Mt. Rainer website (photoshopped) Ground photo 1912
Activity 3: Task 3. Plot your data Already given in data table Need to be graphed
Only connect lines between 4 (high) and 3 (medium confidence) – and leave 2 & 1 unconnected
Example from Glacier X at Mount Rainier High confidence ~0.1 km (100 m) range Med. confidence ~0.2-0.3 km (200-300 m) range Low/VL confidence ~0.5-1 km range (guess) Inform reader: where we’re sure of the data and why…here’s our estimate…we need more research…
Activity 3: Task 4. Example Glacier length increasing… Global temp record shows temp increasing too… Why? Does this make sense? Low confidence for 3 years of data… Note in writing
Activity 3: Task 4. Compare with temperature records—lots of noise & lots of uncertainty Blue dots = avg. annual temp Trend line
Example from Glacier X at Mount Rainier What do the two graphs tell us? Write-up, noting speculative-ness and low/very low confidence levels, but possibilty…
Activity 3: Task 5. Compare with other glacier length records from Oerlemans
Example from Glacier X at Mount Rainier Different is OK…Glaciers have personalities…may not do what “everyone” else does Use fieldwork & maps & other datasets to help us interpret glacier’s personality
Activity 4: Comparing Nisqually to other Glaciers • After scientists conduct research at their study site, most compare results with other locations to discover if their site is an anomaly or reflects a broader trend • Sometimes, scientists do this themselves and make a career studying glaciers • Sometimes, compare with other published studies
Activity 5: Predict the future (~1850) 10,000 100,000 1,000,000
Activity 5: Predict the future WITHOUT anthropogenic influence…
Activity 5: Predict the future Die-out completely, like Kilimanjaro? Advance in another little ice age?