Download
1 / 136
1.36k likes | 1.38k Views
Explore the basics of social network analysis (SNA) and its importance in understanding social structures and relations. Learn about key questions, data structures, measurement methods, and software tools for analyzing networks.

E N D
Introduction to Networks Methods & Measures James Moody jmoody77@soc.duke.edu http://www.soc.duke.edu/~jmoody77/ Duke Network Analysis Center Department of Sociology
Introduction We live in a connected world: “To speak of social life is to speak of the association between people – their associating in work and in play, in love and in war, to trade or to worship, to help or to hinder. It is in the social relations men establish that their interests find expression and their desires become realized.” Peter M. Blau Exchange and Power in Social Life, 1964
Introduction We live in a connected world: * "If we ever get to the point of charting a whole city or a whole nation, we would have … a picture of a vast solar system of intangible structures, powerfully influencing conduct, as gravitation does in space. Such an invisible structure underlies society and has its influence in determining the conduct of society as a whole." J.L. Moreno, New York Times, April 13, 1933 *1934, NYTime. Moreno claims this work was covered in “all the major papers” but I can’t find any other clips…
Introduction But scientists are starting to take network seriously: “Networks”
Introduction But scientists are starting to take network seriously: why? “Obesity” “Networks”
Introduction …and NSF is investing heavily in it.
Introduction High Schools as Networks
Introduction Countryside High School, by grade
Introduction Countryside High School, by race
Introduction And yet, standard social science analysis methods do not take this space into account. “For the last thirty years, empirical social research has been dominated by the sample survey. But as usually practiced, …, the survey is a sociological meat grinder, tearing the individual from his social context and guaranteeing that nobody in the study interacts with anyone else in it.” Allen Barton, 1968 (Quoted in Freeman 2004) Moreover, the complexity of the relational world makes it impossible to identify social connectivity using only our intuition. Social Network Analysis (SNA) provides a set of tools to empirically extend our theoretical intuition of the patterns that compose social structure.
Introduction Social network analysis is: • a set of relational methods for systematically understanding and identifying connections among actors. SNA • is motivated by a structural intuition based on ties linking social actors • is grounded in systematic empirical data • draws heavily on graphic imagery • relies on the use of mathematical and/or computational models. • Social Network Analysis embodies a range of theories relating types of observable social spaces and their relation to individual and group behavior.
Introduction Key Questions Social Network analysis lets us answer questions about social interdependence. These include: “Networks as Variables” approaches • Are kids with smoking peers more likely to smoke themselves? • Do unpopular kids get in more trouble than popular kids? • Do central actors control resources? “Networks as Structures” approaches • What generates hierarchy in social relations? • What network patterns spread diseases most quickly? • How do role sets evolve out of consistent relational activity? Both: Connectionist vs. Positional features of the network We don’t want to draw this line too sharply: emergent role positions can affect individual outcomes in a ‘variable’ way, and variable approaches constrain relational activity.
Introduction • How do we best use these rapidly developing data and methods to promote health and wellbeing? • Goals for today • Two mechanisms for networks & health: connections & positions • Basic network data structures • How are network data different from standard data • Volume measures • 3) Measuring network properties • Reachability • Distance • Redundancy • Centrality • Triad Distributions/hierarchy • Structural Equivalence • 4) Software sneak peak Connections Positions
X Y C Why do networks matter? Two fundamental mechanisms: Problem space P Networks As Result Networks As Cause Connectionist: Positional: Networks as pipes – networks matter because of what flows through them. Networks as roles – networks matter because of relational patterns This rubric is organized around social mechanisms – the reasons why networks matter, which ends up being loosely correlated with specific types of measures & analyses.
X Y C Why do networks matter? Two fundamental mechanisms: Connections P Connectionist network mechanisms : Networks matter because of the things that flow through them. Networks as pipes.
X Y C Why do networks matter? Two fundamental mechanisms: Connections example P The spread of any epidemic depends on the number of secondary cases per infected case, known as the reproductive rate (R0). R0 depends on the probability that a contact will be infected over the duration of contact (b), the likelihood of contact (c), and the duration of infectiousness (D). For STI, the trick is specifying c, which depends on the network.
X Y C Why do networks matter? Two fundamental mechanisms: Connections example Isolated vision P
X Y C Why do networks matter? Why do networks matter? Two fundamental mechanisms: Connections example Connected vision P
Connections: Diffusion Example: Small local changes can create cohesion cascades Emergent Connectivity in “low-degree” networks Partner Distribution Component Size/Shape X Y C P Based on work supported by R21-HD072810 (NICHD, Moody PI), R01 DA012831-05 (NIDA Morris, Martina PI)
X Y C Why do networks matter? Two fundamental mechanisms: Positions P Positional network mechanisms : Networks matter because of the way they capture role behavior and social exchange. Networks as Roles. Romantic Love Provides food for Bickers with
X Y C Why do networks matter? Two fundamental mechanisms: Positions P Positional network mechanisms : Networks matter because of the way they capture role behavior and social exchange. Networks as Roles. Parent Parent Child Child Child Romantic Love Provides food for Bickers with
Why do networks matter? Two fundamental mechanisms: Problem space Networks As Result Networks As Cause Connectionist: Positional: Diffusion Peer influence Social Capital “small worlds” Social integration Peer selection Homophily Network robustness Networks as pipes Popularity Effects Role Behavior Network Constraint Group stability Network ecology “Structuration” Networks as roles This rubric is organized around social mechanisms – the reasons why networks matter, which ends up being loosely correlated with specific types of measures & analyses.
Network Methods & Measures Social network analysis is: • a set of relational methods for systematically understanding and identifying connections among actors. SNA • is motivated by a structural intuition based on ties linking social actors • is grounded in systematic empirical data • draws heavily on graphic imagery • relies on the use of mathematical and/or computational models. • Social Network Analysis embodies a range of theories relating types of observable social spaces and their relation to individual and group behavior.
Network Methods & Measures Books & Resources Hannaman’s online text: great, free, all done w. UCINET: http://www.faculty.ucr.edu/~hanneman/nettext/ Wasserman & Faust 1994
Social Network Data The unit of interest in a network are the combined sets of actors and their relations. We represent actors with points and relations with lines. Actors are referred to variously as: Nodes, vertices or points Relations are referred to variously as: Edges, Arcs, Lines, Ties Example: b d a c e
b d b b d d a c e a a c c e e Social Network Data In general, a relation can be: Binary or Valued Directed or Undirected Directed, binary Undirected, binary b d 1 2 1 3 4 a c e Directed, Valued Undirected, Valued
Social Network Data Basic Data Elements In general, a relation can be: (1) Binary or Valued (2) Directed or Undirected b d a c e Directed, Multiplex categorical edges The social process of interest will often determine what form your data take. Conceptually, almost all of the techniques and measures we describe can be generalized across data format, but you may have to do some of the coding work yourself….
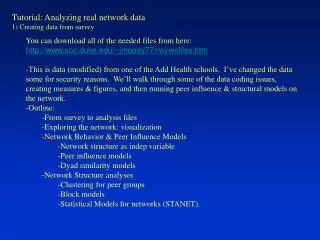
Social Network Data Basic Data Elements: Levels of analysis We can examine networks across multiple levels: 1) Ego-network - Have data on a respondent (ego) and the people they are connected to (alters). Example: 1985 GSS module - May include estimates of connections among alters 2) Partial network - Ego networks plus some amount of tracing to reach contacts of contacts - Something less than full account of connections among all pairs of actors in the relevant population - Example: CDC Contact tracing data for STDs
Social Network Data Basic Data Elements: Levels of analysis We can examine networks across multiple levels: 3) Complete or “Global” data - Data on all actors within a particular (relevant) boundary - Never exactly complete (due to missing data), but boundaries are set • Example: Coauthorship data among all writers in the social sciences, friendships among all students in a classroom
Primary Group Ego-Net Best Friend Dyad 2-step Partial network Social Network Data Basic Data Elements: Levels of analysis Global-Net
Social Network Data Graph Layout (teaser) A good network drawing allows viewers to come away from the image with an almost immediate intuition about the underlying structure of the network being displayed. However, because there are multiple ways to display the same information, and standards for doing so are few, the information content of a network display can be quite variable. Consider the 4 graphs drawn at right. After asking yourself what intuition you gain from each graph, click on the screen. Now trace the actual pattern of ties. You will see that these 4 graphs are exactly the same.
Social Network Data Graph Layout Network visualization helps build intuition, but you have to keep the drawing algorithm in mind. Here we show the same graphs with two different techniques: Spring embedder layouts Tree-Based layouts (Fair - poor) (good) Most effective for very sparse, regular graphs. Very useful when relations are strongly directed, such as organization charts or internet connections. Most effective with graphs that have a strong community structure (clustering, etc). Provides a very clear correspondence between social distance and plotted distance Two images of the same network
Social Network Data Graph Layout Another example: Spring embedder layouts Tree-Based layouts (poor) (good) Two layouts of the same network
Social Network Data Basic Data Structures In general, graphs are cumbersome to work with analytically, though there is a great deal of good work to be done on using visualization to build network intuition. I recommend using layouts that optimize on the feature you are most interested in. The two I use most are a hierarchical layout or a force-directed layout are best. We’ll go into much more detail in the visualization seminar.
Social Network Data Social network data are substantively divided by the number of modes in the data. 1-mode data represents edges based on direct contact between actors in the network. All the nodes are of the same type (people, organization, ideas, etc). Examples:Communication, friendship, giving orders, sending email. This is commonly what people think about when thinking about networks: nodes having direct relations with each other.
Social Network Data Social network data are substantively divided by the number of modes in the data. 2-mode data represents nodes from two separate classes, where all ties are across classes. Examples: People as members of groups People as authors on papers Words used often by people Events in the life history of people The two modes of the data represent a duality: you can project the data as people connected to people through joint membership in a group, or groups to each other through common membership There may be multiple relations of multiple types connecting your nodes.
Social Network Data Basic Data Elements: Modes Bipartite networks imply a constraint on the mixing, such that ties only cross classes. Here we see a tie connecting each woman with the party she attended (Davis data)
Social Network Data Basic Data Elements: Modes Bipartite networks imply a constraint on the mixing, such that ties only cross classes. Here we see a tie connecting each woman with the party she attended (Davis data)
Social Network Data Basic Data Elements: Modes By projecting the data, one can look at the shared between people or the common memberships in groups: this is the person-to-person projection of the 2-mode data.
Social Network Data Basic Data Elements: Modes By projecting the data, one can look at the shared between people or the common memberships in groups: this is the group-to-group projection of the 2-mode data.
Social Network Data Example of a 2-mode network: faculty supervising students - Any list of what people do – meetings, clubs, activities, co-authorship, – that they do with others forms network data. Moody
Social Network Data Example of a 2-mode network: Patients & Care Settings The Movement of Carbapenem-Resistant Klebsiellapneumoniae among Healthcare Facilities: A Network Analysis D van Duin, F Perez, E Cober, SS Richter, RC Kalayjian, RA Salata, N Scalera, R Watkins, Y Doi, S Evans, VG Fowler Jr, KS Kaye, SD Rudin, KM Hujer, AM Hujer, RA Bonomo, and J Moody for the Antibacterial Resistance Leadership Group
Social Network Data Example of a 2-mode network: Patients & Care Settings Casalino, Lawrence P., Michael F. Pesko, Andrew M. Ryan, David J. Nyweide, Theodore J. Iwashyna, Xuming Sun, Jayme Mendelsohn and James Moody. “Physician Networks and Ambulatory Care Admissions” Medical Care 53:534-41
a b c d e b d a 1 a 1 c e b 1 c 1 1 1 d 1 1 e 1 1 Social Network Data Basic Data Structures From pictures to matrices Because network images are hard to work with, we often use an adjacency matrix to represent the network. The matrix (X) at right represents an undirected binary network. Each node (a-e) is listed on both the row and the column. The ith row and the jth column (Xij) records the value of a tie from node i to node j. For example, the line between nodes a and b is represented as an entry in the first row and second column (red at right). Because the graph is undirected the ties sent are the same as the ties receive, so every entry above the diagonal equals the entries below the diagonal. Undirected, binary An undirected graph and the corresponding matrix is symmetric.
a b c d e b d a 1 a c e 1 b c 1 1 1 d e 1 1 Social Network Data Basic Data Structures Directed graphs, on the other hand,are asymmetrical. We can see that Xab =1 and Xba =1, therefore a “sends” to b and b “sends” to a. However, Xbc=0 while Xcb=1; therefore,c “sends” to b, but b does not reciprocate. Directed, binary A directed graph and the corresponding matrix is asymmetrical.
a b c d e a 1 3 b c 2 4 1 d e 2 1 Social Network Data Basic Data Structures Directed graphs, on the other hand,are asymmetrical. We can see that Xab =1 and Xba =1, therefore a “sends” to b and b “sends” to a. However, Xbc=0 while Xcb=1; therefore,c “sends” to b, but b does not reciprocate. b d a c e Directed, Valued A directed graph and the corresponding matrix is asymmetrical.
a b b a c c b d e d c e e c d a b c d e b d a 1 a 1 c e b 1 c 1 1 1 d 1 1 e 1 1 Social Network Data Basic Data Structures From matrices to lists (binary) Social network analysts also use adjacency lists and arc liststo more efficiently store network data. Arc List a b b a b c c b c d c e d c d e e c e d Adjacency List
a 1 b 1 2 c 2 3 1 d 3 1 e 5 1 a b b a c c b d e d c e e c d a b c d e a 1 1 b 2 c 3 5 2 d 3 1 e 5 1 Social Network Data Basic Data Structures From matrices to lists (valued) Social network analysts also use adjacency lists and arc liststo more efficiently store network data. Arc List a b 1 b a 1 b c 2 c b 2 c d 3 c e 5 d c 3 d e 1 e c 5 e d 1 Adjacency List contact value b d 1 1 2 3 a c e 5
Social Network Data Basic Data Structures Working with two-mode data A person-to-group adjacency matrix is rectangular, with persons down rows and groups across columns Each column is a group, each row a person, and the cell = 1 if the person in that row belongs to that group. You can tell how many groups two people both belong to by comparing the rows: Identify every place that both rows = 1, sum them, and you have the overlap. 1 2 3 4 5 A 0 0 0 0 1 B 1 0 0 0 0 C 1 1 0 0 0 D 0 1 1 1 1 E 0 0 1 0 0 F 0 0 1 1 0 A =
1 2 3 4 5 A 0 0 0 0 1 B 1 0 0 0 0 C 1 1 0 0 0 D 0 1 1 1 1 E 0 0 1 0 0 F 0 0 1 1 0 A = A B C D E F 1 0 1 1 0 0 0 2 0 0 1 1 0 0 3 0 0 0 1 1 1 4 0 0 0 1 0 1 5 1 0 0 1 0 0 AT = Social Network Data Basic Data Structures Working with two-mode data One can get either projection easily with a little matrix multiplication. First define AT as the transpose of A (simply reverse the rows and columns). If A is of size P x G, then AT will be of size G x P.