Download
1 / 24
240 likes | 392 Views
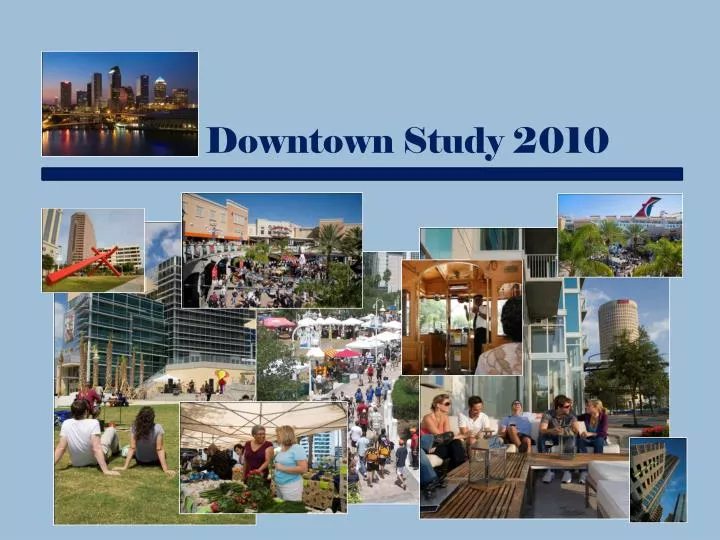
Downtown Study 2010. The Changing Downtown. Results for the initial Downtown Tampa studies, which surveyed residents and workers, were released in 2008. In the time between the baseline survey launch and 2010, there were many changes within the region:. Riverwalk Friday Market

E N D
The Changing Downtown • Results for the initial Downtown Tampa studies, which surveyed residents and workers, were released in 2008. • In the time between the baseline survey launch and 2010, there were many changes within the region: • Riverwalk • Friday Market • Glazer Children’s Museum • Reopening of Art Museum • Tampa Bay History Center • Extended streetcar routes • Reopening of Curtis Hixon Park • Dog park opening • Parking meters that accept credit cards • New directional signage around Downtown • New restaurants • New retail …and an increase in residential occupants.
Research Execution • Data collected in the current study revealed resident and worker reactions to Downtown Tampa, as of the end of 2010. • The online questionnaires—separately collecting responses from Downtown Tampa residents and workers—addressed: • Satisfaction/Participation (retail, transportation, events, venues, activities) • Response to Downtown additions within past 2 years • Interest in potential Downtown additions • Migration patterns • Demographics • Distribution of resident and worker surveys occurred through: • Monday Morning Memo • Street-level invitations (Downtown Guides & HCP) • Mailed invitations (mail-able Downtown residential addresses) • e-blast invitations • Social media • Appeals to local businesses and organizations
Executive Summary-Residents • Population Shift: There was a shift within the residential population in terms of ownership status, age and household income. • Downtown Migration: There was not a significant change in the geographical pattern of movement reported by current Downtown residents, based on their reported prior residential zip code, but there is a numerical increase in out-of-area/out-of-state movement to Downtown. • Motivations to Move Downtown: Changing motivations held by residents reflected the economy, artistic additions and Downtown growth, with increased reactions to affordability, the urban lifestyle, events/special programs/functions and arts/entertainment, and lesser response to taking on the residence as an investment opportunity. • Attraction Participation: Attendance is strong for many of Downtown Tampa’s newest additions—Curtis Hixon Waterfront Park, the Riverwalk, the Tampa Museum of Art and the Tampa Bay History Center—although there is still a strong desire toward seeing some of the potential Downtown attractions come to fruition. • Urban Shopping: In addition to requests for an indoor urban shopping mall, residents reported a high frequency of visits to Bay Area shopping malls. • Residential Affiliations: Resident season ticket holdings reflect the potential presence of a rotating pattern—families deciding to renew different memberships each year instead of renewing all on an annual basis. • Transportation Reactions: Public transit is not currently being optimally used by residents. The 2008 level of satisfaction was not upheld in 2010, for a majority of the measured transportation topics. • Top-of-Mind Categories: Residents mentioned retail, food and transportation, with greatest frequency, in their open-ended responses.
Executive Summary-Workers • Worker Demographic Shift: Respondents represented longer-tenured workers than in the baseline, which is a possible reflection of the changing employee landscape over the past two years. • Downtown Progress: Workers offered positive feedback regarding progress in the following categories: shopping/retail, food/beverage and things to do after work; they continue to express interest in seeing other Downtown categories improve. • Participation Levels: Despite the dispersion of residence of this group, they reported strong participation in Downtown Tampa events and venues, indicating the level of participation of this group, in the area. • Interest in Future Additions: Workers continue to report strong likelihoods of use for potential Downtown improvements, if they were (more) available in Downtown Tampa. • Worker Affiliations: Membership holdings are relatively low among workers, however when projected to the total workforce universe, represent a sizable contribution to the Downtown economy. • Worker Interest in Downtown: Workers expressed a stronger interest in a future move to Downtown, than in 2008. • Transportation Reactions: Public transit usage was reported at low levels by Downtown workers. • Top-of-Mind Categories: Retail, transportation options and more events are still the most frequently referenced comments in worker open-ended responses. More specifically, there were frequent appeals for a grocery store, more activity post-5pm, accessible lunch hour options and light rail. • Requested Additions: The three categories that worker respondents ranked as being top desired areas for improvement were grocery stores, restaurants and clothing stores/boutiques.
Respondent Details • Responses came from residents and workers within the Channel District, the Downtown Core and Harbour Island. • The initial question in both surveys prompted respondents to select their perceived region of residence/employment from a list of Downtown and surrounding areas. • Those who considered themselves to live or work within the Downtown regions of study were invited to complete the remaining questions. • The 2008/2010 comparative tables that you will see within the report reflect data extracted from the baseline study. • Response levels came in at a statistically representative level. Workers Sample universe is estimated to be 50,800* 733 survey respondents Residents Sample universe of residential HHLDs is estimated to be 4,325 436 survey respondents Source: USPS (residents, mail-able addresses within the regions of study); MPO (workers) *Based upon data provided by the MPO, to be updated by summer, 2011
Study Demographics Workers Residents Gender Gender Age Age Household Income Household Income
Changing Demographics • There were some significant changes in the reported demographics by worker and resident respondents. • Residential Study • Renters comprised 45.0% of the growing residential population, versus 25.4% in 2008. • The share of respondents under 45 increased to 60.8%, from 57.6%. • There was a statistical increase in residents with household incomes of less than $100k, now 50.9% from 40.7%. • Worker Study • There were more workers within the 45+ age group—54.6% versus 46.1% in 2008. • Workers reporting a household income of $100k+ also rose from 39.4% to 45.5%. • Respondents reported longer-term employment in Downtown, with 39.0% reporting working in the area 10 or more years, versus 30.1% in 2008.
Prior Residence for Current DT Residents • The strongest migration concentrations were from regions of Hillsborough—New Tampa, Westchase, Town & Country, Carrollwood, West Tampa, South Tampa and Brandon. • There was an increase in movement from outside of the DMA and outside of the state of Florida, as compared to 2008 patterns. • Counties included in the outside of the DMA total were largely in the southern portion of the state. Residents reporting an outside of Florida prior residence were largely from the North, Northeast (CT, DC, DE, MA, MD, NJ, NY).
Downtown Progress • Resident and worker respondents gave the strongest “progress” ratings to the following categories: food/beverage, housing and things to do after work. How is Downtown Tampa progressing on the topics listed? *Residents were not asked to respond to this question in 2008 due to the recency at the time of Downtown’s residential housing availability and a lack of longer term point of reference
Event & Attraction Participation How many times in the past 12 months have you attended the following events and attractions? • Resident • Top 5 Venues & Attractions Visited • Channelside Bay Plaza (94.0%) • Curtis Hixon Waterfront Park (79.9%) • Riverwalk Activities (77.7%) • Non-Lightning Forum Events (72.0%) • Tampa Convention Center (67.2%) • Top 5 Venues & Attractions for Increased Visits • Curtis Hixon Park (+209.3%) • Florida Museum of Photographic Arts (+123.6%) • Tampa Museum of Art (+80.0%) • Tampa Bay Storm Football Games (+35.4%) • Lykes Gaslight Square (+29.4%) • Top 5 Venues & Attractions Visited 4+ Times • Channelside Bay Plaza (73.6%) • Curtis Hixon Waterfront Park (55.0%) • Riverwalk Activities (37.3%) • Tampa Downtown Market (28.8%) • Tampa Bay Lightning Game (25.7%) • Worker • Top 5 Venues & Attractions Visited • Channelside Bay Plaza (79.9%) • Tampa Downtown Market (75.9%) • Lykes Gaslight Square (65.9%) • Curtis Hixon Waterfront Park (63.3%) • Non-Lightning Forum Events (62.8%) • Top 5 Venues & Attractions for Increased Visits • Curtis Hixon Waterfront Park (+115.1%) • Florida Museum of Photographic Arts (+22.0%) • Tampa Museum of Art (+10.1%) • Lykes Gaslight Square (+7.3%) • Tampa Convention Center (+6.3%) • Top 5 Venues & Attractions Visited 4+ Times • Tampa Downtown Market (47.7%) • Channelside Bay Plaza (39.9%) • Lykes Gaslight Square (39.8%) • Curtis Hixon Waterfront Park (31.0%) • Straz Center (19.6%)
Memberships & Season Ticket Holdings • Workers and residents demonstrate a strong commitment to Downtown involvement through memberships and associations. • The top three venues for reported membership were the Tampa Museum of Art, the Florida Aquarium and the Straz Center. • When compared to 2008, residents and workers reported slight changes in their membership holdings, suggesting the possible presence of a rotating pattern. Do you or someone in your household currently have a membership or season tickets for any of the activities and venues listed?
Likely Participation & Use • Respondents reported strongest likelihood of use for waterfront dining and an indoor urban shopping mall, if they were more available in Downtown Tampa. • Respondents reported an increase in their likelihood of use versus 2008(*), for waterfront dining, an indoor urban shopping mall, outdoor art park and upgraded Wi-Fi access in public areas. • Of the measured categories that were new to the 2010 study, respondents reported greatest likelihood of use for light rail and extended rubber-wheel trolley routes. If available or more prevalent, how likely would you be to participate in or utilize the following in Downtown Tampa?
Shopping Mall Visits (Residents) • Residents reported strong monthly shopping participation at the majority of the measured malls. • Focusing on the closest shopping malls to Downtown, approximately 4 in 10 or more residents reported visiting West Shore Plaza and/or International Plaza three or more times in a typical month. Resident visits three or more times monthly increased to International Plaza, versus 2008. In a typical 30 days, how often would you or someone in your household visit the following shopping centers?
Projected Purchase Frequencies (Residents) • If more available within Downtown, approximately 1 in 2 resident respondents reported likely daily to weekly use of: • Coffee shops/cafes • Bars • Convenience stores • Health clubs/gyms • Pharmacies/drug stores • Approximately 3 in 4 resident respondents reported daily to weekly use of: • Grocery stores • Casual dining restaurants • Restaurants in general If they were more readily available, what would your frequency of use be for the following categories within the Downtown Tampa region?
Projected Purchase Frequencies (Workers) • If more available, more than 1in 4 worker respondents reported either daily or weekly usage of: • Book/Music stores • Health clubs/Gyms • Pharmacies/Drug stores • Moderate department stores • Clothing stores/boutiques • Approximately 1 in 2 reported daily to weekly usage of: • Grocery stores • Convenience stores • Coffee shops/Cafes • Casual dining restaurants • Restaurants in general If they were more readily available, what would your frequency of use be for the following categories within the Downtown Tampa region?
Factors Motivating a Downtown Move • The urban lifestyle, exposure to art/entertainment and events/special programs/functions continue to be the strongest factors that motivated current residents to take residence in Downtown Tampa. • The only decline of statistical significance was with regard to investment opportunity; affordability was rated more favorably in 2010. Select your top three motivations for moving to Downtown Tampa.
Open-Ended Comments • Unaided open-ended comments carried a common theme of “more”. In 2008, comments were largely demanding that various elements be brought into Downtown. Currently the appeal is for the area to continue bringing in more—more activities, more restaurants and more things to do. Highlights of resident comments: • More parks • Grocery store • Chain restaurants • Restaurants with extended hours • More bike lanes • Inexpensive transportation • More events • Concert series • Movies on the lawn Highlights of worker comments: • Light rail • Grocery store • Better nightlife • Inexpensive parking • Accessible lunch hour options
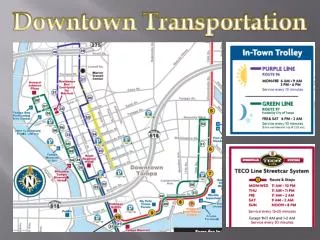
Transportation • The most commonly reported mode of transportation used was personal vehicle; locomotion by foot was also frequently reported. Resident respondents reported relatively high frequency of use additionally, for bicycles, taxicabs and the TECO Line Streetcar. • While resident satisfaction levels declined for the majority of measured transportation categories, worker satisfaction increased. • The TECO Line Streetcar, HART Rubber-Wheel Trolley and taxicabs were the categories receiving the highest satisfaction ratings. Rate your satisfaction with the following Downtown Tampa transportation-related topics.
Downtown Worker Commute Expenditures • In 2008, there was a more concentrated presence of commuters within Hillsborough County, but also a broader span with workers commuting from the north and south ends of the DMA (Citrus and Sarasota counties). • Below is a breakdown of the estimated annual vehicle expenses associated with work commutes for each distance from Downtown Tampa. Pasco Hillsborough 31.0% provided a zip within 5 miles, and therefore spend an estimated $600-$1,500. 14.5% provided a zip within 5 to 10 miles, and therefore spend an estimated $1,500-$2,600. 27.0% provided a zip within 10 to 20 miles, and therefore spend an estimated $2,600-$5,100. 21.1% provided a zip within 20 to 30 miles, and therefore spend an estimated $5,100-$8,000. 3.9% provided a zip within 30 to 40 miles, and therefore spend an estimated $8,000-$10,000. Pinellas Source: AAA Your Driving Costs, 2010 Edition—assumes $0.566 as average cost per mile, which incorporates average fuel, maintenance, tires, insurance, registration, taxes, depreciation and loan interest
Employment Details • More than half (56.5%) of resident respondents reported having a 15 minute or less commute—slightly down from 2008 (59.4%). • 37.0% of workers reported a 30 minute or more commute, significantly down from 2008 (45.6%). • Respondents were for the most part employed fulltime, with 85.3% of residents and 95.5% of Downtown workers, reporting this type of employment. Resident Commute to Work Worker Commute to Work
Interest in Downtown (Workers) • Downtown worker response reflected interest in a move to Downtown Tampa within the next 5 years. • Reported interest increased versus 2008, although not to a statistically significant level. Please note how interested you are in living in Downtown Tampa within the next five years.
Overview Summary • The housing market has changed—Thereare more occupied residences, more rental units and increased interest expressed by workers in a future move to Downtown Tampa. • The Downtown worker has changed—Worker respondents reflected an older demographic, with higher income and longer tenure. • Downtown residential migration patterns have changed—Although there is not a statistical increase, movement from outside of the immediate area and outside of the state has increased since 2008. • There are positive reactions towards the possibility of MORE—Residents and workers reported strong likelihood of use of possible Downtown additions and echoed this interest in their open-ended comments. • A return to Downtown shopping is in demand—Likelihood of use, of an indoor urban shopping mall, was high in 2008 and even higher in 2010, among resident and worker respondents. • There is strong activity involvement by residents and workers—Frequency of participation is high for many measured Downtown venues—especially some of its newest additions. • Workers are interested in moving to Downtown—The interest levels reported reflect a greater demand than the current number of units available. • Public transportation is perceived differently by residents and workers—Current resident satisfaction levels for the majority of measured topics were lower than in 2008, while workers reported largely improved satisfaction ratings.
Additional Information • For additional crosstabs, or individual reports, please contact The Tampa Downtown Partnership. The requested data can be tabulated for an appropriate fee. • Contact: Paul Ayres, Director of Marketing & Business Development payres@tampasdowntown.com 813.221.3686