Download
1 / 23
230 likes | 341 Views
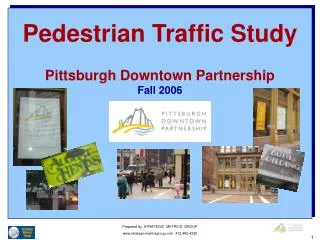
Downtown Pittsburgh IDA Member Image Study. Wave I Summary July 2007. Prepared by: STRATEGIC METRICS GROUP www.strategicmetricsgroup.com 412.480.4332. METHODOLOGY. Online survey sent via e-mail to approximately 1,200 IDA members on in June, 2007.

E N D
Downtown Pittsburgh IDA Member Image Study Wave I Summary July 2007 Prepared by: STRATEGIC METRICS GROUP www.strategicmetricsgroup.com 412.480.4332
METHODOLOGY • Online survey sent via e-mail to approximately 1,200 IDA members on in June, 2007. • Brief questionnaire solicited perception of Downtown Pittsburgh on an overall basis as well as on 18 specific attributes. • A total of 139 respondents completed the questionnaire.
RESPONDENT PROFESSIONAL POSITION The vast majority of survey respondents have high-level positions in their respective downtown organizations.
KEY FINDINGS • Overall Perception of Pittsburgh is good. • On a 1-9 scale of appeal, 51% gave a score of 7-9 and 73% gave a score of 6-9. The mean was 6.1. • Pittsburgh is associated with being a “Sports Center” more so than any other attribute measured. • The six attributes with the most potential to impact overall perception of Pittsburgh are: • Vibrant, Clean, Youthful, Innovative, High-tech and Energetic • “Arts and Culture Center”, “Education Center”, “Unique” and “Corporate HQ” are among the attributes that are highly descriptive of Pittsburgh. • Pittsburgh is not considered to be “High-Tech”, “Edgy”, “Youthful” or “Green / Environmental.” These are the region’s best kept “secrets.” • Any visit to Pittsburgh within the past 10 years is positively correlated to perceptions of Downtown.
SUMMARY OF VERBATIM COMMENTS The legacy of steel manufacturing in Pittsburgh continues to define the city for many. Many comments related to buildings, bridges and other architectural aspects emerge as a common theme. Most comments were of a positive nature. N= 79 Respondents 116 Coded comments When you hear “Downtown Pittsburgh” what is the first thing that comes to mind?
OVERALL PERCEPTION OF DOWNTOWN PITTSBURGH Mean 6.16 Not appealing at all Very appealing Please indicate your overall perception of Downtown Pittsburgh. Use a scale from 1 to 9, where 1 = “Not appealing at all” and 9 = “Very appealing” to indicate your response.
SUMMARY OF DESCRIPTIVE ATTRIBUTES Top 3 Box % Predominant Attribute Highly Descriptive Moderately Descriptive Not at all Descriptive
SUMMARY OF DESCRIPTIVE ATTRIBUTES Sorted By Difference Between Top 3 and Bottom 3 Box % Predominant Attribute Highly Descriptive Moderately Descriptive Not at all Descriptive Bottom 3 Box % Top 3 Box %
MOST DESCRIPTIVE ATTRIBUTES Sports Center Arts and Culture Mean 6.44 Mean 7.10 Friendly Corporate HQ Mean 6.09 Mean 6.14 Using a scale from 1 to 9 where 1 = ”Does not describe at all” and 9 = ”Describes very well”, indicate how well the following phrases describe Downtown Pittsburgh.
MOST DESCRIPTIVE ATTRIBUTES Unique Attractive Mean 5.94 Mean 5.75 Education Center Mean 5.91 Using a scale from 1 to 9 where 1 = ”Does not describe at all” and 9 = ”Describes very well”, indicate how well the following phrases describe Downtown Pittsburgh.
MODERATELY DESCRIPTIVE ATTRIBUTES Safe Beautiful Mean 5.75 Mean 5.68 Fun Vibrant Mean 5.74 Mean 5.50 Using a scale from 1 to 9 where 1 = ”Does not describe at all” and 9 = ”Describes very well”, indicate how well the following phrases describe Downtown Pittsburgh.
MODERATELY DESCRIPTIVE ATTRIBUTES Energetic Clean Mean 5.34 Mean 5.54 Innovative Mean 5.23 Using a scale from 1 to 9 where 1 = ”Does not describe at all” and 9 = ”Describes very well”, indicate how well the following phrases describe Downtown Pittsburgh.
LEAST DESCRIPTIVE ATTRIBUTES High Tech Edgy Mean 4.71 Mean 5.09 Youthful Green/Environmental Programs Mean 4.72 Mean 4.46 Using a scale from 1 to 9 where 1 = ”Does not describe at all” and 9 = ”Describes very well”, indicate how well the following phrases describe Downtown Pittsburgh.
FAMILIARITY WITH PITTSBURGH 60% have visited Pittsburgh within the past 3 years or less.
INFLUENCE OF VISITS ON PERCEPTIONS Top 3 Box % Bold items reflect highest % of top 3 box for the attribute • Those who have not been to the area in a while are most likely to define Pittsburgh by one dimension, Sports. • Recent visitors are more likely to see Pittsburgh as edgy and “green.”
DESIRABILITY DRIVER ANALYSIS
Purpose of Desirability Driver Analysis Reveal the key triggers to overall perception with a product or brand, or in this case, a downtown region. Break down traditional “perception” measures into a salient attribute set that can be traced and tracked over time Prioritize and design initiatives targeted to improve overall perception. OVERVIEW OF METHODOLOGY Basics of the Analysis Combines 2 respondent measurements: 1 - Performance = The % of respondents w/ high ratings 2 - Impact = The rate of change in performance The Management Tool The 2 measures are plotted on the Desirability Driver Map, a tool that prioritizes which attributes of product / brand warrant attention
THE DESIRABLITY DRIVER MAP • The DDA Map combines performance ratings (perception) and impact values to classify and prioritize evaluation criteria into 4 categories: 1. Maintain 2. Critical Maintenance 3. Improve 4. Critical Improvement • “Critical Improvement”, the fourth quadrant of the map, contains the attributes which have the greatest impact on Downtown Pittsburgh’s overall rating, and which currently are performing (rated) the worst. • Improving the performance of “Critical Improvement” attributes will most directly improve the overall rating and overall perception of Downtown Pittsburgh. This quadrant’s attributes warrant the most attention.
DESIRABILITY DRIVER MAP 1. Maintain 2. Critical Maintenance PERFORMANCE 3. Improve 4. Critical Improvement IMPACT VALUE
DESIRABILITY DRIVER MAP 1. Maintain 2. Critical Maintenance Sport Arts HQ Uniq Ed Fr PERFORMANCE B Attr Fun Safe E Vibr Clean Inn Hi-T Edgy Green Youth 3. Improve 4. Critical Improvement IMPACT VALUE Inn = Innovative Youth = Youthful E = Energetic Safe Hi-T = High Tech Clean Edgy Vibr = Vibrant Fun Green Attr = Attractive Ed = Education Center B = Beautiful Arts = Art/Cultural Center Fr = Friendly HQ = Corporate Headqtrs Uniq = Unique Sport = Sports Center
SUMMARY OF DDA GRID The Critical Improvement quadrant displays the satisfaction components which have a higher than average impact on Downtown’s overall image, but a lower than average performance score. Critical Improvement areas: Vibrant Clean Youthful Innovative High-tech Energetic The Critical Maintenance quadrant displays the attributes which have a higher than average impact on overall Pittsburgh Image and a higher than average performance score. Critical Maintenance applies to the following: • Critical Maintenance areas: • Fun • Attractive • Unique • Friendly • Beautiful Improving the perception and association of Downtown Pittsburgh with these attributes is the most direct way to improve Downtown Pittsburgh’s overall perception.
RECOMMENDATIONS Leverage strength of attributes that currently define Pittsburgh. • Continue to promote Arts and Cultural District assets. • Use the Sports Center connection as a hook, but try to help audiences see the region beyond that. Get the word out on Pittsburgh’s lesser-known attributes. • “High-tech” and “Youthful” – Greater potential for overall impact • “Edgy” and “Green” – Much lower potential for impact Improve attributes that matter the most • Focus on improving the perception of Pittsburgh on the attributes that fall in the Critical Improvement quadrant will have the most impact on overall perception.